


 النبات
 الحيوان
 الأحياء المجهرية
 علم الأمراض
 التقانة الإحيائية
 التقنية الحيوية المكروبية
 التقنية الحياتية النانوية
 علم الأجنة
 الأحياء الجزيئي
 علم وظائف الأعضاء
 الغدد
الغدد
 المضادات الحيوية
|
Read More
Date: 29-4-2021
Date: 28-11-2015
Date: 1-6-2021
|
Contrast Variation
“Contrast” in scattering and diffraction experiments is defined as the difference between the mean scattering density of a component and its background, which can be a solvent or other components of an assembly of biological molecules. The greater the contrast, the more readily a component can be distinguished from its surroundings. “Contrast variation” involves the manipulation of the contrasts of specific components in a system in order to extract structural information on individual components. Contrast variation used in combination with small-angle scattering is a powerful method for examining the shapes and interactions of biological molecules in solution. If one has ordered samples, then contrast variation used in combination with neutron diffraction experiments can give important information on the location of disordered components that cannot be seen in X-ray diffraction experiments.
1. Contrast Variation with Neutrons
Either contrast variation experiments take advantage of inherent differences in scattering density between components of a complex or assembly, or the experimenter introduces contrast into the system by manipulating the scattering density of a specific component. Scattering densities are calculated by summing the scattering amplitudes of each atom within a volume and dividing by that volume. Because X-rays are scattered by electrons and the X-ray scattering amplitudes of atoms increase monotonically with the number of electrons, it is difficult to change the scattering density of a biological molecule in a benign way. On the other hand, neutrons provide extremely elegant and practical means for contrast variation. Neutrons are scattered by atomic nuclei in a sample. Hence neutron scattering amplitudes depend upon the complex properties of the neutron–nucleus interaction, and they show no systematic dependence on atomic number. Furthermore, isotopes of the same element can have very different neutron scattering properties. For neutrons, one of the largest differences in neutron scattering amplitude is between the isotopes of hydrogen (1H and 2H).
Table 1 lists the coherent, elastic neutron scattering amplitudes for the atoms commonly found in biological systems. Note that the scattering amplitudes for most nuclei are positive and
approximately equal. The exception is the scattering amplitude for 1H which is negative, resulting from a 180° phase shift between neutrons scattered by 1H compared to the other nuclei. As a consequence, the neutron scattering density of a particle depends strongly on its mean hydrogen content. The basic biological constituents, proteins, polynucleotides, and lipids, each have quite different mean neutron scattering densities (Fig. 1). Furthermore, the scattering densities for pure 1H2O and 2H2O bracket the values for biological constituents. Thus by simply varying the 2H2O:1H2O ratio in the solvent, one can do a contrast variation experiment on a protein–DNA complex, or a membrane protein in a bilayer. For a complex of proteins, selective deuteration of individual proteins provides a way of altering their mean neutron scattering densities for contrast variation studies. Recently, it has been demonstrated that one can obtain dramatically increased contrast effects using a novel method of “spin contrast variation.” This method uses polarized neutron scattering from samples labeled with dynamically polarized nuclei and has been demonstrated to be effective for studying biological systems by locating RNA (1) and proteins (2, 3( in ribosomes.
Table 1. Coherent Neutron Scattering Lengths, bcoh, and Corresponding X-Ray Scattering Factors, fX-ray, for Biologically Relevant Nuclei
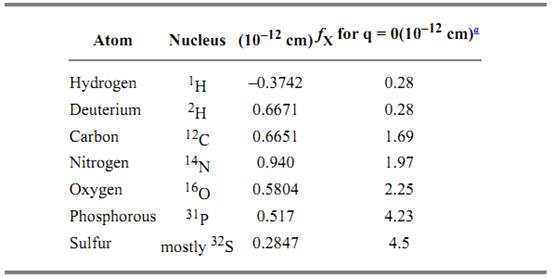
a X-ray scattering amplitudes are normally given in units of electrons, but have been converted to cm here for comparison with neutron scattering amplitudes. At very short wavelengths and low-Q, the X-ray coherent scattering cross-section of an atom with Z electrons is 4p(Zr0)2, where r0 = e2/mec2 = 0.28 × 10⁻¹² cm.
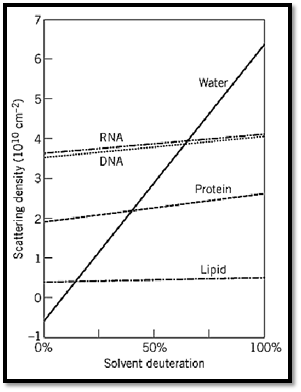
Figure 1. Average scattering length densities for biological molecules as a function of the fraction of D2O in the solvent. The slope of the lines arises from the exchange of labile hydrogens.
2. Small-Angle Scattering with Contrast Variation
The scattering intensity distribution from a homogeneous solution of monodisperse particles in a solution can then be expressed as

The integration is taken over the volume of the particle. Q is the momentum transfer or scattering vector amplitude and is equal to 4p(sin q)/l, where q is half the scattering angle, and l is the wavelength of the incident neutron radiation. Dr(r) = r(r) – rs is the “contrast,” or neutron scattering density difference between the particle and the solvent. For uniform scattering density particles, if one can “match,” or make equal, the scattering density of a particle and its solvent, then the small-angle scattering from that particle will be zero; that is, the particle will become “invisible” in the scattering experiment. For a multicomponent assembly, one can use this technique to study the shape of an individual component within the assembly. Rigorous solvent matching can be difficult, however, and is made more difficult when there are significant internal density fluctuations within the component being matched.
For a two-component complex in solution, one can conduct a series of measurements at different contrast points (“contrast series”) to extract the basic scattering functions of individual components. Ignoring internal scattering density fluctuations, the scattering from a two-component complex in solution can be written as

The subscripts 1 and 2 refer to each component; and Dr1(2) = r1(2) – rs, where r1(2) is that mean scattering density for component 1 (or 2). I1(Q) and I2(Q) represent the scattering of components 1 and 2, respectively, while I12(Q) is the cross term. A set of scattering measurements with different solvent scattering densities, or contrasts, gives a set of equations in the form of equation 2, which can be solved by linear least-squares regression to give the three basic scattering functions I1(Q), I2(Q,( and I12(Q). Using these functions, the individual structural parameters for each component such as molecular weight, radius of gyration, Rg, and the pair distribution function, P(r), can be calculated, as well as information on the relative dispositions of the individual components (see Small-Angle Scattering and Radius Of Gyration for details). P(r) is the probable frequency distribution of all vector lengths between pairs of volume elements within the scattering component, weighted by the product of the scattering densities of each pair of volume elements. P(r) is calculated as the indirect Fourier transform of the basic scattering function for each component, and its second moment gives Rg for that component. The indirect Fourier transform of the cross term I12(Q) gives the pair distribution function containing intercomponent vector lengths, which can give information on the distance between the two components.
Ibel and Stuhrmann (4) proposed an alternative approach to determining the relative dispositions of components in a complex. They showed that the Rg2 dependence on the scattering contrast can be written as

where Rm is Rg at infinite contrast; and Dr = r – rs, where r is the mean scattering density for the complex and rs is the scattering density of the solvent. The coefficient a is related to the second moment of the scattering density fluctuations about the mean value for the complex, while b is related to the square of the first moment of the density fluctuations about the mean. If the sign of a is positive, the lower scattering density component is more toward the inside of the complex than the higher scattering density component. A negative a indicates the reverse. b is proportional to the square of the separation of the centers of mass of the two components. If b is zero, then the centers of mass are coincident.
3. Deuteration of Biological Molecules
Neutron scattering and/or diffraction experiments using contrast variation frequently depend upon the ability to reconstitute complexes with specific components labeled uniformly with deuterium. Deuteration of biological molecules is achieved by growing microorganisms on deuterated media. Relatively high average levels of deuteration (50% for nucleic acids, 70 to 80% for proteins) can be achieved by growing organisms on 2H2O with normal protiated carbon sources (5). Typically, however, the aromatic groups are not highly deuterated using this approach. Higher levels of enrichment (> 99%) are achieved using deuterated nutrients and 2H2O (5). Deuterated algal hydrolysate provides an excellent rich growth medium for E. coli containing an expression system with a specific protein of interest. If the expression is sufficiently robust, deuteration can be achieved in minimal growth media with deuterated glucose, glycerol, or succinate in 2H 2O. Intermediate levels of uniform deuterium labeling can be achieved by diluting 2H with 1H in the growth medium.
4. Examples of the Application of Contrast Variation
4.1. Small-Angle Scattering and Contrast Variation
Examples of significant advances based on small-angle neutron scattering with contrast variation include: the solution structure of the nucleosome core particle showing the DNA winding around the outside of the histone core (6, 7); mapping the radial distribution of protein and nucleic acid components in the influenza virus (8); determining the subunit structure of DNA-dependent RNA polymerase (9) and its relationship to a 130-bp DNA fragment (10); the subunit structure of a ribosome particle, showing the dispositions its components (11, 12); and the determination of the conformations and dispositions calmodulin complexed with its target enzymes (13) and of the evolutionarily related muscle protein troponin C (TnC) complexed with its regulatory target troponin I (TnI) (13) which acts as a calcium-sensitive “switch” to regulate the contractile apparatus. Figure 2 illustrates this latter experiment, showing the model derived from a neutron contrast series on complexes of TnI with deuterated TnC in its calcium-saturated form (14) . The neutron data show TnC in the complex has the unusual dumbbell shape evident in the TnC crystal structure (15, 16), while TnI forms a spiral structure that passes through two hydrophobic clefts in each globular domain of TnC. The diameter of the TnI central spiral is close to that expected for an a-helix. The model suggests a mechanism for the action of the calcium-sensitive TnC/TnI molecular switch. The hydrophobic cleft of the N-terminal regulatory domain of TnC alternately opens and closes (in response to calcium binding and release) and thus binds and releases TnI, which in turn switches “off” and “on” TnI's inhibition of the interactions between the muscle fibers required for contraction.
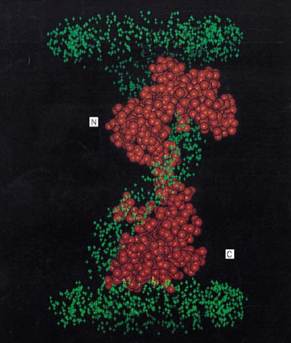
Figure 2. Model structure for the muscle protein complex troponin C/troponin I derived from small-angle neutron scattering and contrast variation (14). Troponin C is represented as a space filling model based on its crystal structure, and the green crosses represent the volume occupied by the troponin I. This figure is based on work done at Los Alamos National Laboratory.
4.2. Diffraction Experiments with Contrast Variation
In crystals of large biomolecular complexes, there are frequently disordered regions, even when the diffraction data extend to relatively high resolution. The scattering from the disordered components is seen predominantly at low-Q—that is, in the “small-angle” region where the contrast effects can be strong. Deuteration strategies similar to those used in small-angle neutron scattering allow for contrast manipulation. Phase information can be derived for the low-Q data using contrast-variation procedures (17), beginning with starting phases from a X-ray crystallography or a model structure and using the contrast-variation relationships to produce the best scattering-density maps (18). Examples of experiments using contrast variation and low-resolution neutron crystallography include the determination of the location of 25% of the protein and the RNA in crystals of the Tomato Bushy Stunt Virus (19) that were “missing” in the 2.8 Å resolution X-ray structure. The most important conclusion of this study is that at the virus radius where the protein and RNA interact, the quasi-equivalence of the 180-protein subunits breaks down, and the RNA interacts preferentially with 60 of the subunits. This observation favors a model for self-assembly in which the RNA interacts with trimers of protein to form an icosahedral scaffolding in which the gaps are filled by the other 120 subunits which have nonspecific contacts with the RNA. Another example of the application of low-resolution neutron diffraction and contrast variation is in membrane protein crystallography, where it has been used to locate and orient detergent molecules with respect to the protein (20, 21). These experiments take advantage of the inherent high contrast between detergent and 2H2O; and they provide information on the role of detergent in membrane protein crystallization, as well as the potential lipid–protein interactions.
References
1. J. Wadzack et al. (1997) J. Mol. Biol. 266, 343–356.
2. R. Willumeit et al. (1996) J. Mol. Struct. 383, 201–211.
3. J. Zhao and H. B. Stuhrmann (1993) J. Phys. IV 3, 233–236.
4. K. Ibel and H. B. Stuhrmann (1975) J. Mol. Biol. 93, 255–265.
5. H. L. Crespi (1977) Stable Isot. Life. Sci., Proc. Tech. Comm. Meet. Mod. Trends Biol. Appl. Stable Isot., IAEA, Vienna, pp. 111–121.
6. J. F. Pardon et al. (1975) Nucleic Acids Res. 2, 2163–2176.
7. P. Suau et al. (1977) Nucleic Acids Res. 4, 3769–3786.
8. S. Cusack, R. W. H. Ruigrok, P. C. J. Krygsman, and J. E. Mellema (1985) J. Mol. Biol. 186, 582-565.
9. P. Stöckel et al. (1980) Eur. J. Biochem. 112, 411–417 and 419–423.
10. H. Lederer, K. Mortensen, R. P. May, G. Baer, H. L. Crespi, and H. Heumann (1991) J. Mol. Biol. 219, 747–755.
11. M. S. Capel, D. M. Engelman, B. R. Freeborn, M. Kjeldgaard, J. A. Langer, V. Ramakrishnan, D. G. Schindler, D. K. Scheider, B. P. Schoenborn, I. Y. Sillers, S. Yabuki, and P. B. Moore (1987) Science 238, 1403–1406.
12. R. P. May, V. Nowotny, P. Nowotny, H. Voß, and K. H. Nierhaus (1992) EMBO J. 11, 373–378.
13. J. K. Krueger, G. Zhi, J. T. Stull, and J. Trewhella (1998) Biochemistry 37, 13997–14004.
14. G. A. Olah and J. Trewhella (1994) Biochemistry 33, 12800–12806.
15. O. Herzberg and M. N. G. James (1985) Nature (London) 313, 653–659.
16. M. Sundaralingham et al. (1985) Science 227, 945–948.
17. M. Roth, A. Lewitt-Bentley, and G. A. Bentley (1984) J. Appl. Crystallogr. 17, 77–84.
18. M. Roth (1991) In Int. Union Crystallogr., Crystallogr. Symp. 5 (Crystallogr. Comput. 5) (D. M. Moras, and A. D. Podjarny, eds.), Oxford University Press, Oxford, U.K., pp. 229–248.
19. P. Timmins, D. Wild, and J. Witz (1994) Structure 2, 1191.
20. M. Roth et al. (1989) Nature 340, 659–662.
21. P. Timmins, E. Pebay-Peyroula, and W. Welte (1994) Biophys. Chem. 53, 27–36.

|
|
|
|
دور في الحماية من السرطان.. يجب تناول لبن الزبادي يوميا
|
|
|
|
|
|
|
العلماء الروس يطورون مسيرة لمراقبة حرائق الغابات
|
|
|
|
|
|
|
انطلاق الجلسة البحثية الرابعة لمؤتمر العميد العلمي العالمي السابع
|
|
|