
One-component systems
 المؤلف:
Peter Atkins، Julio de Paula
المؤلف:
Peter Atkins، Julio de Paula
 المصدر:
ATKINS PHYSICAL CHEMISTRY
المصدر:
ATKINS PHYSICAL CHEMISTRY
 الجزء والصفحة:
ص177-178
الجزء والصفحة:
ص177-178
 2025-11-15
 28
28
One-component systems
For a one-component system, such as pure water, F = 3 − P. When only one phase is present, F = 2 and both p and T can be varied independently without changing the number of phases. In other words, a single phase is represented by an area on a phase diagram. When two phases are in equilibrium F = 1, which implies that pressure is not freely variable if the temperature is set; indeed, at a given temperature, a liquid has a characteristic vapour pressure. It follows that the equilibrium of two phases is represented by a line in the phase diagram. Instead of selecting the temperature, we could select the pressure, but having done so the two phases would be in equilibrium at a single definite temperature. Therefore, freezing (or any other phase transition) occurs at a definite temperature at a given pressure. When three phases are in equilibrium, F = 0 and the system is invariant. This special condition can be established only at a definite temperature and pressure that is char acteristic of the substance and outside our control. The equilibrium of three phases is therefore represented by a point, the triple point, on a phase diagram. Four phases cannot be in equilibrium in a one-component system because F cannot be negative. These features are summarized in Fig. 6.2. We can identify the features in Fig. 6.2 in the experimentally determined phase diagram for water (Fig. 6.3). This diagram summarizes the changes that take place as a sample, such as that at a, is cooled at constant pressure. The sample remains entirely gaseous until the temperature reaches b, when liquid appears. Two phases are now in equilibrium and F = 1. Because we have decided to specify the pressure, which uses up the single degree of freedom, the temperature at which this equilibrium occurs is not under our control. Lowering the temperature takes the system to c in the one-phase, liquid region. The temperature can now be varied around the point c at will, and only when ice appears at d does the variance become 1 again.
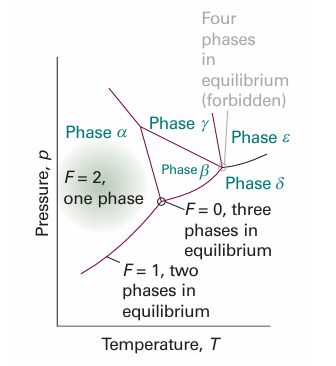
Fig. 6.2 The typical regions of a one component phase diagram. The lines represent conditions under which the two adjoining phases are in equilibrium. A point represents the unique set of conditions under which three phases coexist in equilibrium. Four phases cannot mutually coexist in equilibrium.
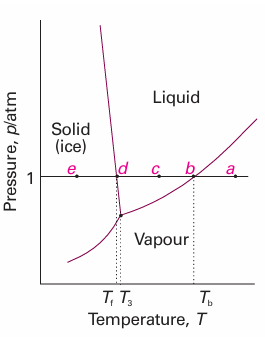
Fig. 6.3 The phase diagram for water, a simplified version of Fig. 4.5. The label T3 marks the temperature of the triple point, Tb the normal boiling point, and Tf the normal freezing point.
 الاكثر قراءة في مواضيع عامة في الكيمياء الفيزيائية
 اخر الاخبار
اخبار العتبة العباسية المقدسة


