

 علم الكيمياء
 الكيمياء التحليلية
 الكيمياء الحياتية
 الكيمياء العضوية
 الكيمياء الفيزيائية
 الكيمياء اللاعضوية
 مواضيع اخرى في الكيمياء
 الكيمياء الصناعية
 |
Read More
Date: 16-4-2017
Date: 17-7-2017
Date: 16-4-2017
|
Obtaining a Representative Sample
The sampling process must ensure that the items chosen are representative of the bulk of material or population. The items chosen for analysis are often called sampling units or sampling increments. For example, our population might be 100 coins, and we might wish to know the average concentration of lead in the collection of coins. Our sample is to be composed of 5 coins. Each coin is a sampling unit or increment. In the statistical sense, the sample corresponds to several small parts taken from different parts of the bulk material. To avoid confusion, chemists usually call the collection of sampling units or increments, the gross sample.
For analysis in the laboratory, the gross sample is usually reduced in size and homogenized to create the laboratory sample. In some cases, such as sampling powders, liquids, and gases, we do not have obvious discrete items. Such materials may not be homogeneous because they may consist of microscopic particles of different compositions or, in the case of fluids, zones where concentrations of the analyte differ. With these materials, we can prepare a representative sample by taking our sample increments from different regions of the bulk material. Figure 1.1 illustrates the three steps that are usually involved in obtaining the laboratory sample.

Figure 1.1 Steps in obtaining a laboratory sample. The laboratory sample consists of a few grams to at most a few hundred grams. It may constitute as little as 1 part in 107 or 108 of the bulk material. Step 1 is often straightforward with the population being as diverse as a carton of bottles containing vitamin tablets, a field of wheat, the brain of a rat, or the mud from a stretch of river bottom. Steps 2 and 3 are seldom simple and may require tremendous effort and ingenuity.
Statistically, the goals of the sampling process are:
1. To obtain a mean analyte concentration that is an unbiased estimate of the population mean. This goal can be realized only if all members of the population have an equal probability of being included in the sample.
2. To obtain a variance in the measured analyte concentration that is an unbiased estimate of the population variance so that valid confidence limits can be found for the mean, and various hypothesis tests can be applied. This goal can be reached only if every possible sample is equally likely to be drawn.
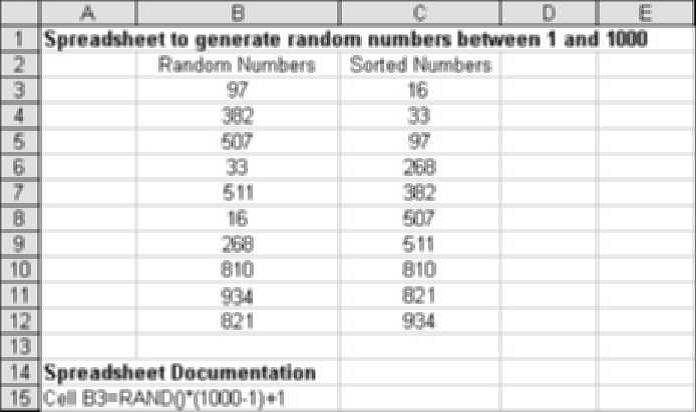
Both goals require obtaining a random sample. Here the term random sample does not imply that the samples are chosen in a haphazard manner. Instead a randomization procedure is applied to obtain such a sample. For example, suppose our sample is to consist of 10 pharmaceutical tablets to be drawn from 1000 tablets off a production line. One way to ensure the sample is random is to choose the tablets to be tested from a table of random numbers. These can be conveniently generated from a random number table or from a spreadsheet as is shown in Figure 1.2.

Figure 1.2 Generating 10 random numbers from 1 to 1000 by a spreadsheet. The random number function in Excel [=RAND()] generates random numbers between 0 and 1. The multiplier shown in the documentation ensures that the numbers generated in column B will be between 1 and 1000. In order to obtain integer numbers, we right click on the selected cells and choose Format Cells… from the drop down menu. We then choose Number and then 0 decimal places. So that the numbers do not change with every recalculation, the random numbers in column B were copied and then pasted as values into column C using the Paste Special… command on the Home ribbon. In column C the numbers were sorted in ascending order using Excel’s Data Sort… command on the Data ribbon.


|
|
|
|
تفوقت في الاختبار على الجميع.. فاكهة "خارقة" في عالم التغذية
|
|
|
|
|
|
|
أمين عام أوبك: النفط الخام والغاز الطبيعي "هبة من الله"
|
|
|
|
|
|
|
المجمع العلمي ينظّم ندوة حوارية حول مفهوم العولمة الرقمية في بابل
|
|
|