آخر المواضيع المضافة

 تاريخ الرياضيات
الرياضيات في الحضارات المختلفة
الرياضيات المتقطعة
الجبر
الهندسة
المعادلات التفاضلية و التكاملية
التحليل
علماء الرياضيات
تاريخ الرياضيات
الرياضيات في الحضارات المختلفة
الرياضيات المتقطعة
الجبر
الهندسة
المعادلات التفاضلية و التكاملية
التحليل
علماء الرياضيات | Box-and-Whisker Plot |


|
|
Read More
Date: 29-3-2021
Date: 27-4-2021
Date: 8-3-2021
|

A box-and-whisker plot (sometimes called simply a box plot) is a histogram-like method of displaying data, invented by J. Tukey. To create a box-and-whisker plot, draw a box with ends at the quartiles  and
and  . Draw the statistical median
  as a horizontal line in the box. Now extend the "whiskers" to the farthest points that are not outliers (i.e., that are within 3/2 times the interquartile range of
  and
and  ). Then, for every point more than 3/2 times the interquartile range from the end of a box, draw a dot. If two dots have the same value, draw them side by side (Gonick and Smith 1993, p. 21). Box-and-whisker plots are implemented as BoxWhiskerPlot[data] in the Wolfram Language package StatisticalPlots` .
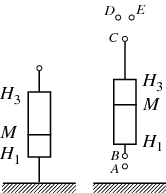
A number of other slightly different conventions are sometimes used. In Tukey's original definition, the closely-related and lesser known hinges  and
and  were used instead of
  and
and  (Tukey 1977, p. 39). In addition, Tukey's original formulation lacked horizontal crossbars, extended the whiskers all the way to the extreme data points, and drew an unfilled dot at the maximum and a hatched horizontal strip at the minimum, as illustrated above (left figure; Tukey 1977, p. 40). A variation extended the whiskers only out to some arbitrary minimum and maximum values and identifying the outliers with explicit labels (Tukey 1977, p. 41). Tukey also considered an additional variation in which the outliers are indicated separately and whiskers are dashed, ending with dashed crossbars at "adjacent values" (values closest to but still inside the inner fences).
REFERENCES:
Chambers, J.; Cleveland, W.; Kleiner, B.; and Tukey, P. Graphical Methods for Data Analysis. Belmont, CA: Wadsworth, 1983.
Gonick, L. and Smith, W. The Cartoon Guide to Statistics. New York: Harper Perennial, p. 21, 1993.
NIST/SEMATECH. "Box Plot." §1.3.3.7 in NIST/ SEMATECH e-Handbook of Statistical Methods. http://www.itl.nist.gov/div898/handbook/eda/section3/boxplot.htm.
Tukey, J. W. "Box-and-Whisker Plots." §2C in Exploratory Data Analysis. Reading, MA: Addison-Wesley, pp. 39-43, 1977.
|
|
|
|
4 أسباب تجعلك تضيف الزنجبيل إلى طعامك.. تعرف عليها
|
|
|
|
|
|
|
أكبر محطة للطاقة الكهرومائية في بريطانيا تستعد للانطلاق
|
|
|
|
|
|
|
مشاتل الكفيل تزيّن مجمّع أبي الفضل العبّاس (عليه السلام) بالورد استعدادًا لحفل التخرج المركزي
|
|
|