

 النبات
 الحيوان
 الأحياء المجهرية
 علم الأمراض
 التقانة الإحيائية
 التقنية الحيوية المكروبية
 التقنية الحياتية النانوية
 علم الأجنة
 الأحياء الجزيئي
 علم وظائف الأعضاء
 الغدد
الغدد
 المضادات الحيوية
|
Read More
Date: 11-11-2020
Date: 1-4-2021
Date: 28-4-2016
|
Flow Cytometry
Flow cytometric analysis of eukaryotic cells, also known as fluorescence-activated cell sorting (FACS), was first developed in the late 1960s. FACS has been a tool primarily of immunologists because of its power in dissecting the complex subsets of cells derived from the blood. It has found clinical application in the classification of leukemias and lymphomas, as well as a tool for prognosis in HIV disease. Because of the relative expense of the equipment, it has been slow to progress into many other areas of biological research. However, the past decade has seen significant expansion in the techniques that are designed for FACS analysis. In particular, several developments came about that make FACS an extremely powerful tool for molecular biology analysis. These include (a) the development of FACS-based assays for reporter genes (initially, b-galactosidase; now including several other hydrolases) and (b) the introduction of the inherently fluorescent proteins, such as green fluorescent protein. As the technology becomes cheaper and more widespread, these applications (and others) will become a common tool in the arsenal of molecular biology.
1. Molecular Biology by FACS: A Basic Overview
Flow cytometry is a technology that characterizes populations of cells, on a cell-by-cell basis, in terms of their fluorescence properties. Several different fluorescent signals can be monitored simultaneously and independently. On the basis of the amount of each fluorescence exhibited by each cell, the instrument can decide whether that cell should be sorted (separated from all others) or simply discarded. The sorted cells can be recovered in a viable state for further biochemical processing or culture. Most flow cytometric sorters can process as many as 5000 cells per second, with excellent purity and specific recovery of cells occurring as infrequently as one in a million.
Fluorescence is the fundamental parameter evaluated by a flow cytometer, so the most common molecular biology technique performed by FACS is quantification of reporter gene activity. Thus, either intrinsic or enzymatically generated fluorescence serves as the surrogate assay for the number of protein molecules synthesized from a particular gene construct introduced into the cell. The intensity of the fluorescence is, in general, linearly related to the expression from the gene construct, so the FACS can quantify directly, on a cell-by-cell basis, the translation/transcription activity of the reporter gene.
It is important to recognize that the measurement is made on each cell independently, so the analysis of a cell population can be displayed as a distribution of activities. Thus, heterogeneous gene expression within a population can be resolved; for example, the presence of a few highly expressing cells along with a majority of nonexpressing cells is easily detected. Furthermore, the sorting capabilities of the instrument can then be used to isolate either the positive or negative cell fraction.
Cells are passed through the interrogating laser beam one-by-one in a stream, so it is necessary that the sample be prepared as a suspension of individual cells. It is possible to monitor adherent cell populations after removing the cells from the substrate—for example, by treatment with a proteinase such as trypsin . It is not possible, however, to use the FACS on solid tissue samples without dispersing the cells. Virtually any cell type can be used; successful assays have been performed on bacteria, yeast, and Drosophila cells, as well as on a wide variety of mammalian cells.
2. Reporter Genes assays for FACS
The most common application of FACS in molecular biology is the quantitative measurement of reporter gene expression. A variety of reporter genes are amenable to FACS analysis, including cell surface markers, hydrolases, and GFP. Surface markers are genes coding for membrane-bound proteins that are not normally expressed by the cells of interest. These can be detected using fluorescently conjugated monoclonal antibodies and standard immunophenotyping methods. These assays are not necessarily quantitative; that is, the amount of surface expression may not always correlate with transcriptional activity. The introduction of foreign proteins on the surface of cells also prevents the introduction of such cells into a host, because of immunological rejection.
The other types of assays rely on intracellular expression of proteins that can be detected enzymatically or are inherently fluorescent, such as GFP. In 1988, Nolan et al. developed the first FACS-based assay for an enzymatic reporter gene (1-3). This assay uses the fluorogenic substrate fluorescein digalactoside (FDG). FDG is nonfluorescent until hydrolyzed; it can be easily introduced into the cytoplasm of cells. Cells that have high b-galactosidase activity (eg, that are transfected with the bacterial lacZ gene controlled by a promoter active in the host cells) will hydrolyze the FDG to yield fluorescent fluorescein. The amount of fluorescence generated is quantitatively related to the amount of cellular b-galactosidase. This assay has extreme sensitivity (it can detect cells with as few as 5 molecules of enzyme) and a large dynamic range (at least 5 orders of magnitude). More recently, assays for b-glucuronidase and b-glucosidase have also been introduced that are similar to the one for b-galactosidase (4).
The last few years has seen an explosion in the use and development of GFP as a reporter gene. A variety of mutations have been introduced into the gene to produce proteins that are more highly fluorescent and with altered fluorescence spectra. The primary advantage of the GFP assay is ease of use: the expressing cells become spontaneously fluorescent. In addition, the genes encoding the varieties of GFP are relatively small (~1.5 kb) compared to lacZ (~3.5 kb), giving greater flexibility in designing vectors.
3. Why Is FACS Such a Powerful Tool?
There are three principal reasons:
1. FACS analyses collect data on each individual cell, presenting the data as a distribution of activity.
2. FACS analysis is multiparametric (the ability to measure several parameters simultaneously on each cell).
3. The FACS can viably sort cells based on these measurements.
4. Analysis of a Distribution
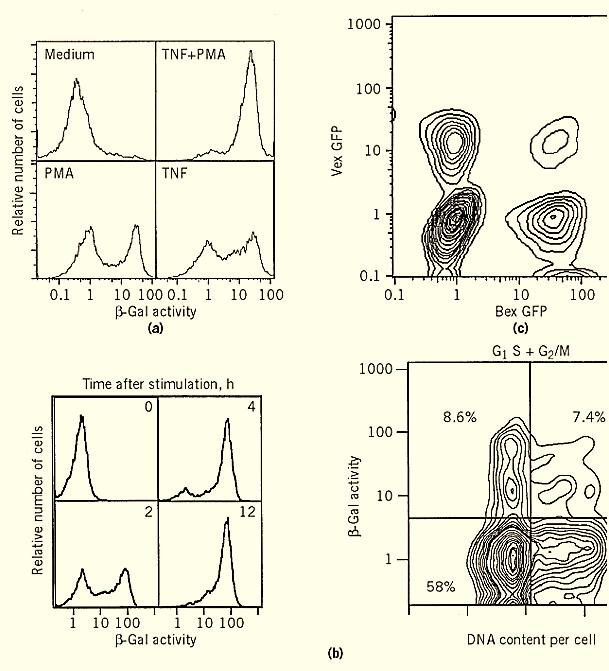
Biological systems are rarely, if ever, homogeneous. Indeed, even the responsiveness of a clone is often complex. This has become even more evident since the advent of FACS analysis. Figure 1 shows two examples of such heterogeneity. These examples demonstrate how a cloned population of cells (which has a uniform, single integration of a reporter gene construct) responds in a heterogeneous way to stimulations. It is immediately apparent that such complexity is completely missed by using standard, bulk assays for reporter gene activity. Bulk assays measure the average amount of activity in a population, with no information about the distribution within that population. The figure demonstrates that the signal transduction mediated by effector molecules does not affect all cells identically; some respond rapidly, whereas others remain resting for at least a period of time.

Figure 1. Three examples of flow cytometric analysis of gene expression.
5. The Power of Multiparametric Analysis
A typical FACS experiment can measure at least three different fluorescent species, in addition to measurements related to cell size and shape. Thus, one can combine a typical reporter gene expression assay (using one fluorescent channel) together with two other assays. These might include assays to measure DNA or RNA content, cell surface phenotype, viability, and so on. In addition, one could choose a second, independent reporter gene assay using a second color, in order to measure simultaneously two independent genetic elements (ie, enhancers, promoters, repressors. (Figure 1 c shows such an analysis, using two different versions of the inherently fluorescent protein GFP (5). Another analysis that can benefit from such simultaneous measurement is the dissection of enhancer elements. By transfecting the same cells with different reporter genes fused to different enhancer elements, one can now measure the relative activity of each enhancer element in the same cell in response to stimulations.
6. Sorting (Selection(
Perhaps one of the most underutilized capabilities of the FACS is the ability to sort cells viably based on any of the measurement parameters. Effectively, this means that any reporter gene used in the context of the FACS becomes (in addition) a selectable marker. Selection by FACS has several advantages over standard drug-based cytotoxic selectable markers. Generally, selectable marker systems rely on a combination of toxic compounds and genes that encode resistance or sensitivity to the toxic compound. These systems work by killing or halting the growth of all cells that do not (or do) produce some threshold amount of the protein encoded by the selectable marker gene.
Survival-dependent selection systems have several disadvantages. For example:
1. The selection system is inherently toxic, often even to cells expressing the resistance gene.
2. The selection generally takes many cell divisions, or a period of weeks for mammalian cells.
3. The cells below (or above) the threshold amount of the selecting protein are dead and unavailable for further study.
4. It is difficult or impossible to select for different expression levels of the marker.
5. The cells must generally be able to reproduce in culture.
On the other hand, FACS analysis of reporter genes allows the sorting capabilities of the FACS to isolate cells based on virtually any level of expression of the nontoxic reporter genes. The FACS can analyze and sort from as many as 5000 cells per second, so 1 cell in 10 million could be selected in an hour of sorting, making FACS as efficient as drug-based selectable markers.
The ability to select cells based on a particular level of expression is a big advantage over standard selection methods, for several reasons. First of all, cells expressing very low levels of the b-galactosidase enzyme (eg, 10 molecules) can be detected and sorted; such low levels might not be sufficient to confer drug resistance. Second, cells expressing virtually any level of enzyme can be selected (for instance, only those expressing more than 100,000 molecules per cell). Third, cells that rapidly change expression of the reporter gene in response to a stimulus can be selectively sorted. These capabilities give FACS assays the ability to select cells that would be impossible to select using standard drug selection methods.
Finally, the ability to sort cells based on gene expression levels allows the concomitant determination of other parameters that can only be determined by, for example, biochemical assays on lysates. For instance, by sorting cells with different expression levels and then doing messenger RNA quantification on the sorted cells, a comparison of message levels within defined subsets of a population can be done (eg, see Ref. 2).
7. Summary
Besides the analysis of reporter genes, other technologies are becoming available for FACS analysis. For instance, fluorescent in situ hybridization (FISH) for both RNA and DNA, even after in situ polymerase chain reaction (PCR), has been successfully performed by FACS. The FACS-based enzyme assays have also been extended to nonmammalian systems. Reporter gene analysis has been performed in plant cells (6), Drosophila cells (7), yeast (8), and bacteria (8, 9), complete with viable sorting of the cells for further analysis.
Flow cytometric analysis is an aspect of the majority of immunologically related research, as can be evidenced by perusing any immunology journal. Since the relatively recent introduction of this technology to molecular biology, it has been growing quickly as the applications become more advanced and as the technology becomes more accessible. Flow cytometry has already proven to be a unique and powerful adjunct for molecular analyses; in the years to come, it will undoubtedly become a common tool.
References
1. G. P. Nolan, S. Fiering, J. F. Nicolas, and L. A. Herzenberg (1988) Proc. Natl. Acad. Sci. USA. 85, 2603-2607.
2. S. Fiering, M. Roederer, G. P. Nolan, D. R. Micklem, D. R. Parks, and L. A. Herzenberg (1991( Cytometry 12, 291–301.
3. M. Roederer, S. N. Fiering, and L. A. Herzenberg (1991) Methods 2, 248–260.
4. M. Lorincz, M. Roederer, L. A. Herzenberg, and G. P. Nolan (1996) Cytometry 24, 321–329.
5. M. T. Anderson, I. M. Tjioe, M. C. Lorincz, D. R. Parks, L. A. Herzenberg, G. P. Nolan, and L. A. Herzenberg (1996) Proc. Natl. Acad. Sci. USA 93, 8508–8511.
6. D. W. Galbraith, G. M. Lambert, R. J. Grebenok, and J. Sheen (1995) Methods Cell Biol. 50, 3–14.
7. M. A. Krasnow, S. Cumberledge, G. Manning, L. A. Herzenberg, and G. P. Nolan (1991( Science 251, 81–85.
8. R. Nir, Y. Yisraeli, R. Lamed, and E. Sahar (1990) Appl. Environ. Microbiol. 56, 3861–3866.
9. F. Russo-Marie, M. Roederer, B. Sager, L. A. Herzenberg, and D. Kaiser (1993) Proc. Natl. Acad. Sci. USA 90, 8194–8198.


|
|
|
|
علامات بسيطة في جسدك قد تنذر بمرض "قاتل"
|
|
|
|
|
|
|
أول صور ثلاثية الأبعاد للغدة الزعترية البشرية
|
|
|
|
|
|
|
مستشفى العتبة العباسية الميداني في سوريا يقدّم خدماته لنحو 1500 نازح لبناني يوميًا
|
|
|