


 تاريخ الرياضيات
 الرياضيات في الحضارات المختلفة
 الرياضيات المتقطعة
 الجبر
الجبر
 الهندسة
 المعادلات التفاضلية و التكاملية
 التحليل
 علماء الرياضيات
 |
Read More
Date: 17-6-2019
Date: 7-1-2016
Date: 1-1-2016
|
When a ball bounces, different mathematical models can describe what happens. If the ball bounces in place several times, a geometric sequence or exponential model describes the maximum height that the ball attains in relation to the number of bounces. For any single bounce, a quadraticmodel describes the height of the ball at any point in time.
Exponential Model: Maximum Height
To examine the maximum height a bouncing ball attains, ignore external factors such as air resistance. A ball bounced in place recovers a certain percentage of its original height. For example, suppose a ball that recovers 70 percent of its height is dropped from 200 feet. The maximum height it reaches after its first bounce is 70 percent of 200 feet, or 140 feet. After the second bounce, it reaches a height of 70 percent of 140 feet, or 98 feet. In similar fashion, the ball continues to rebound to a height that is 70 percent of the highest point of the previous bounce. The graph below illustrates these maximum heights.
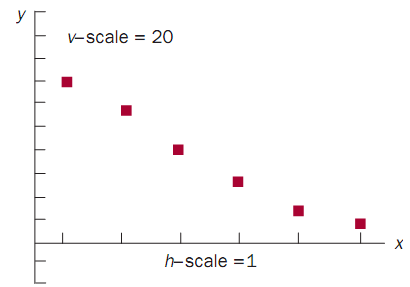
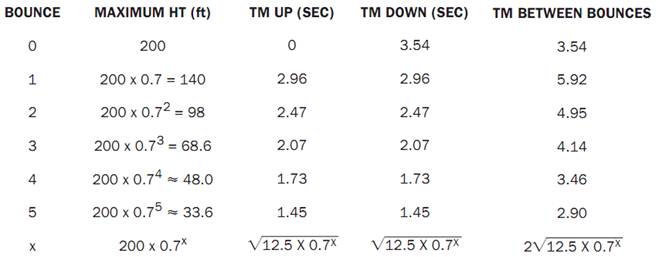
Because each successive maximum height is found by multiplying the previous height by the same value, this is a geometric sequence. The maximum height can also be expressed as an exponential function, with the domain restricted to whole numbers. For this example, the maximum heights attained are shown on the next page, with values rounded to the nearest tenth of a foot.
Infinite Bouncing. Because the height of each successive bounce continues to be 70 percent of a positive number, the ball’s bounce, in theory, will never reach a zero height. In practice, however, the ball loses energy and does eventually stop bouncing.
It is possible to calculate the total distance the ball travels in this theoretical world of endless bounces. Initially, the ball travels 200 feet. It then bounces up 140 feet and falls 140 feet, a total of 280 feet. It then bounces up 98 feet and falls 98 feet, a total of 196 feet. This pattern continues.
After the initial 200 feet, an infinite geometric series appears: 280 +196 +137.2 + 96.04 + . . . . Summing this series with the formula S =

feet. Adding the initial 200 feet, the total distance that the ball travels is 1133 1/3 feet.
Quadratic Model: Height of Single Bounce
To consider the height of the ball at any given point in time, again assume a recovery of 70 percent, an initial height of 200 feet, and no air resistance.
Using a formula from physics that relates an object’s height to the length of time it has been falling, b= 16t2 (16 is half the rate of acceleration due to gravity in feet per second squared), it can be determined how long it takes to fall from each height. Note that it takes the same amount of time to reach a height as it takes to fall from it.
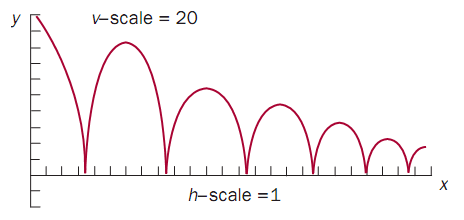
This relationship is a series of parabolas of decreasing height (because the maximum height decreases) and decreasing width (because the time between bounces decreases). Algebraically, if h represents the height and t represents the time, the first parabola can be expressed as b = 200- 16t2, where 0 ≤ t < 3.54.
Between the first and second bounces, the height can be expressed as b = 140 - 16(t - 6.49)2, 3.54 ≤ t< 9.45. The 6.49 is when the highest point is achieved (halfway between the two bounces), and the 9.45 seconds is derived from adding 3.54 seconds to the time between the first and second bounces. It is at this time that the ball bounces again. One could continue deriving these equations in similar fashion. The figure below shows
this series of parabolic arcs.
A Forward-Moving Bouncing Ball. Now assume that a ball, held at 200 feet, is thrown horizontally at the rate of 1 foot per second. The ball accelerates downward, acted upon by gravity, as it continues to travel horizontally, maintaining its horizontal rate of 1 foot per second. Because it accelerates downward at the same rate as a ball bounced in place, the heights of the two balls are identical at any point in time. Consequently, the graphs
of their heights in relation to time are identical.
But consider graphs that would show the paths traveled by the balls.
The path of the in-place ball is contained within a vertical line. The path of the thrown ball, however, forms parabolic arcs: as it accelerates downward, it continues to travel at a constant speed in a horizontal direction. In this example, given the horizontal component of 1 foot per second, and supposing that the units on the horizontal axis are labeled in feet instead of seconds, the graph of the thrown ball’s path exactly matches the graph of its height over time. But if the horizontal speed is other than 1, the scaling must be adjusted. SEE ALSO Exponential Growth and Decay; Quadratic Formula and Equations.
______________________________________________________________________________________________
Reference
O’Connor, James J. “Forever May Only Be a Few Seconds.” Mathematics Teacher 92, no. 4 (1999):300–301.
|
|
|
|
علامات بسيطة في جسدك قد تنذر بمرض "قاتل"
|
|
|
|
|
|
|
أول صور ثلاثية الأبعاد للغدة الزعترية البشرية
|
|
|
|
|
|
|
مكتبة أمّ البنين النسويّة تصدر العدد 212 من مجلّة رياض الزهراء (عليها السلام)
|
|
|