

 النبات
 الحيوان
 الأحياء المجهرية
 علم الأمراض
 التقانة الإحيائية
 التقنية الحيوية المكروبية
 التقنية الحياتية النانوية
 علم الأجنة
 الأحياء الجزيئي
 علم وظائف الأعضاء
 الغدد
الغدد
 المضادات الحيوية
|
Read More
Date: 2-4-2021
Date: 1-11-2015
Date: 2-5-2016
|
Ethidium Bromide
Ethidium bromide (phenanthridinium, 3,8-diamino-5-ethyl-6-phenyl-, bromide) is a heteroaromatic cationic dye (an aminoacridine) with the molecular formula C21H20BrN3 and a relative molecular mass of 394.31 (Figs. 1, 2). It exists as a dark red crystalline or amorphous powder at standard temperatures and pressures. It has a melting point (and decomposition temperature) between 533 and 535 K, moderately high solubility in water (5 g/100 mL), and is essentially odorless. Ethidium bromide is a powerful mutagen, extremely toxic by inhalation, ingestion (LD50 1503 mg/kg oral, rat), and skin contact, and a suspected carcinogen and reproductive toxin.

Figure 1. Ball-and-stick representation of the ethidium bromide molecule (phenanthridinium, 3,8-diamino-5-ethyl-6-phenyl-, bromide). RMM = 394.31.

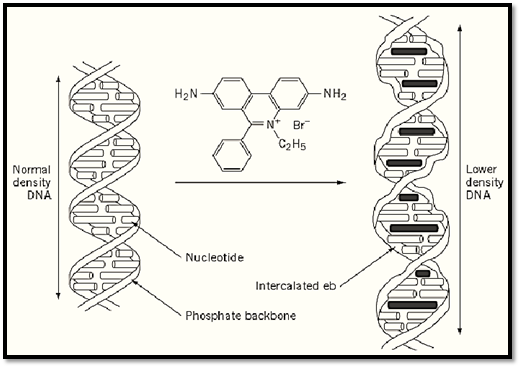
Figure 2. The intercalation of ethidium bromide into a portion of a DNA double helix. The intercalated dye increases the spacing of successive base pairs, distorts the regular phosphate backbone, and reduces the pitch of the helix.
Originally, ethidium bromide (EB) found fame in the late 1940s as an antitrypanosomal, antimicrobial, antibacterial, and antiviral agent (1). It is generally agreed that these biological effects are a direct consequence of the inhibition of nucleic acid synthesis, which in turn is related to the specific binding of the drug to DNA. EB inhibits DNA polymerase and binds in vitro to both RNA and DNA. Investigation into the precise nature of the DNA-EB binding mechanism led to the discovery that the drug (and many other related molecules) binds by a mechanism termed intercalation. This process has been studied extensively during the past three decades, and the photophysical changes that accompany intercalation have been successfully applied to quantitate and structurally elucidate DNA. The nature of the DNA-EB interaction and subsequent analytical applications are the focus of this article.
1. Photophysical Characteristics of EB
EB is dark yellow in aqueous solution and possesses a broad structureless absorption spectrum (lmax ~ 480 nm). Increasing EB concentration leads to a red shift in the absorption maximum, accompanied by hypochromism. The existence of an isobestic point reflects a simple equilibrium between monomeric and dimeric species (2). EB is weakly fluorescent in aqueous solution and possesses a broad structureless emission spectrum)lmax ~ 617 nm). The low fluorescent quantum yield and short fluorescent lifetime (3) in aqueous solution are attributed to efficient quenching of the excited state by the transfer of a proton to an adjacent water molecule (4, 5). Moreover, the EB dimer is not fluorescent and consequently provides an efficient mechanism for fluorescent quenching when EB is complexed in the dimeric form. Both of these phenomena prove important when EB interacts with DNA.
2. Intercalation of Dyes with DNA
Modification of DNA by binding with dyestuffs suspected to have possible chemotherapeutic effects was noted as early as the 1940s in the pioneering work of Michaelis (6). The classic intercalation mechanism for the physical interaction between drugs and DNA is discussed elsewhere in this volume, but the characteristics of dye intercalation with DNA were established primarily with reference to aminoacridones (7) and EB (1). Consequently, the fundamental attributes of classic intercalation are outlined. Very simply, intercalation describes the insertion of planar heteroaromatic molecules between adjacent nucleotide base pairs of a DNA duplex. Intercalative binding follows the neighbor exclusion principle, where every second site along the helix remains unoccupied, and thus EB intercalation occurs through interaction of the phenantridinium ring with the duplex (8). This leads to a very elegant binding model (Fig. 2). More specifically, the EB–DNA complex involves hydrogen bonding between the 3,8 amino substituents of the EB molecule and the phosphate groups across the two DNA strands. These hydrogen bonds maintain the orientation of the EB cation with respect to the polymer frame (9). The simplicity of this model was naturally extended to explain the interaction of other molecules with DNA. These included antitumor antibiotics whose mode of action involves interference with nucleic acid synthesis (1). The intercalation mechanism of EB with double-stranded DNA can be thought of as consisting of three fundamental features: [1] helix extension (Fig. 2); [2] local, helical unwinding during binding; and [3] insertion of EB so that the plane of the aromatic chromophore is perpendicular to the helical axis. This binding process has been confirmed by various experimental approaches including, X-ray crystallography (10), autoradiography (11), NMR spectroscopy (12), equilibrium studies (13), viscosity measurements (14), and calorimetry (15). Nevertheless, optical measurements have played the dominant role in the use of the EB to DNA interaction. Consequently they are discussed in detail here.
3. Intercalation of EB with DNA
The formation of a metachromatic complex between EB and DNA can be simply observed by measuring the absorption spectrum. As the DNA to EB ratio increases, the absorption spectrum shifts to longer wavelengths (3, 16, 17). The formation of such complexes causes a shift due to the stabilization of the excited state upon binding (9). The shift is observed only at high DNA to EB ratios because an excess of free dye normally masks the absorbance contribution of bound EB. Importantly, a binding constant of 2.1×10⁶M–1 demonstrates the high affinity of EB of DNA (18).
More relevant to the use of EB in molecular biology are the observed variations in its fluorescent characteristics on binding to polynucleotides. Broadly, both the time-integrated fluorescent intensity and the average molecular fluorescent decaytime increase dramatically on interaction with DNA (eg, the fluorescent decay time of EB in water is about 1.8 ns, compared to 23 ns in DNA) (3, 8, 19, 20). This variation can be explained by reference to Figure 2. When EB intercalates with the double helix, it sits in the hydrophobic pocket of the base pair system and is shielded to a large extent from solvent molecules. Consequently, the rate of excited state quenching (via proton transfer to solvent molecules) decreases, leading to an increase in both the fluorescent decay time and the fluorescent quantum yield. Because the fluorescent intensity of EB in aqueous solution is very small (due to a low fluorescent quantum yield), measuring the fluorescent signal when bound to DNA provides the most common method for DNA detection in the molecular biology laboratory (e.g., in slab gel electrophoresis and capillary zone electrophoresis ) (21-23). Furthermore, the fluorescent enhancement has resulted in extensive use of EB as a probe of the topological (24, 25) and dynamic (26-29) properties of DNA.
EB is widely used as a probe in clinical DNA assays. The selective binding of EB to double-stranded DNA, combined with the exquisite sensitivity of fluorescent spectroscopy, provides an obvious route to DNA quantitation on a nanogram scale (30). With excitation at 520 nm and emission at 600 nm, EB fluorescence is enhanced approximately 30-fold in upon binding to duplexes. Moreover, the use of fluorescence detection for quantitative purposes is favorable because fluorescent enhancement ispractically independent of base composition (31-33).
Nevertheless, care must be taken when using EB as a quantitative probe of DNA. Numerous studies have demonstrated a modification in the classic intercalative behavior of EB with high dye concentrations. In addition to conventional intercalation, there is also EB binds secondarily through an external site (most likely along the phosphate backbone). Binding to this secondary site occurs most readily at low ionic concentrations (<0.1 M), after binding at primary sites has been saturated ( (3, 14, 19, 21 . Secondary binding is most clearly evidenced by the heterogeneous nature of fluorescent decay profiles originating from high EB to DNA ratios (3, 19). The true nature of secondary binding is still poorly understood. It must be accounted for, however, when relating time-integrated fluorescent intensities to the amounts of double-stranded DNA. In addition, variations in the fluorescent quantum yield of EB intercalated into heterogeneous natural DNA (eg, calf thymus DNA) as a function of salt concentration and temperature suggest that the detailed features of the EB to DNA complex are inextricably linked to the overall structural properties of the binding sites on the duplex chain (9).
The huge interest in the clinical use of compounds that bind strongly to DNA as antitumor agents at low concentrations has led to the study of a related class of EB compounds. Appropriately designed dimers of EB have binding affinities and fluorescent enhancements much higher than those of the monomer (18, 34, 35). Glazer and co-workers synthesized an ethidium homodimer, illustrated in Figure 3, that bisintercalates at a ratio of one dimer per four to five base pairs and is stable on electrophoresis gels. The system was used successfully to detect and quantify DNA fragments with picogram sensitivity subsequent to an electrophoretic separation (36). Current applications of bisintercalators of this kind include multiplex detection of DNA restriction fragments (37), high sensitivity detection of the products from the polymerase chain reaction (PCR ) (36), sizing of individual double-stranded DNA fragments by flow cytometry, and the study of DNA–protein interactions (38). Furthermore, DNA probes that have a double-stranded region (for intercalation sites) and a single-stranded region (for recognition of specific target sequences) offer an exciting application for this generation of versatile fluorescent probes.

Figure 3. Chemical structure of an ethidium homodimer.
References
1. M. J. Waring (1975) Antibiotics III. Mechanism and Action of Antimicrobial and Antitumor Agents (J. W. Corcoran and F. E. Hahn, eds.), Berlin, Heidelberg, pp. 141–165.
2. M. Guenza and C. Cuniberti (1988) Spectrochim. Acta 44A(12), 1359–1364.
3. C. D. Byrne and A. J. de Mello (1998) Biophys. Chem. 70, 173–184.
4. S. J. Atherton and P. C. Beaumont (1984) Photobiochem. Photobiophys. 8, 103–113.
5. J. Olmsted and D. R. Kearns (1977) Biochemistry 16, 3647–3654.
6. L. Michaelis (1947) Cold Spring Harbor Symp. Quant. Biol. 12, 131–142.
7. R. M. Acheson (1973) Acridines (R. M. Acheson ed.), Wiley, London, p. 878.
8. J. B. LePecq (1976) Biochemical Fluorescence: Concepts II (R. Chen and H. Edelhoch eds.), Dekker, New York, pp. 711–736.
9. C. Cuniberti and M. Guenza (1990) Biophys. Chem. 38, 11–22.
10. C. C. Tsai, S. C. Jain, and H. M. Sobell (1977) J. Mol. Biol. 114, 301–315.
11. J. Cairns (1962) Cold Spring Harbor Symp. Quant. Biol. 27, 311–318.
12. S. Chandrasakaran, R. L. Jones, and W. D. Wilson (1985) Biopolymers 24, 1963–1979.
13. W. D. Wilson, C. R. Krishnamoorthy, Y. Wang, and J. C. Smith (1985) Biopolymers 24, 1941–1961.
14. J. B. Le Pecq and C. Paoletti (1967) J. Mol. Biol. 27, 87–106.
15. F. Quadrifoglio, V. Crescenzi, and V. Giancotti (1974) Biophys. Chem. 2, 319–324.
16. M. J. Waring (1968) Nature 219, 1320–1322.
17. Y. S. Babayan, G. Manzini, and F. Quadrifoglio (1988) Mol. Biol. 22(4), 714–725.
18. B. Gaugain et al. (1978) Biochemistry 17, 5078–5088.
19. D. P. Heller and C. L. Greenstock (1994) Biophys. Chem. 50, 305–312.
20. V. W. F. Burns (1969) Arch. Biochem. Biophys. 133, 420–424.
21. J. Yguerabide and A. Ceballos (1995) Anal. Biochem. 228, 208–220.
22. B. Olszanska and A. Borgul (1990) Acta Biochim. Pol. 37(1), 59–63. 23. S. Premaratne, S. D. Swenson, M. Mandel, and H. F. Mower (1994) Biochim. Biophys. Acta 1219, 422–424.
24. T. Ide and R. Basuga (1976) Biochemistry 15, 600.
25. S. A. Winkle, L. S. Rosenberg, and T. R. Krug (1982) Nucleic Acids Res. 10, 8211–8223.
26. D. P. Millar, R. J. Robbins, and A. H. Zewail (1982) J. Chem. Phys. 76, 2080–2094.
27. D. Magde, M. Zappala, W. J. Know, and T. M. Nordlund (1983) J. Chem. Phys. 87, 3286–3288.
28. J. C. Thomas and J. M. Schurr (1983) Biochemistry 22, 6194–6198.
29. T. Hard and D. R. Kearns (1986) J. Phys. Chem. 90, 3437–3444.
30. A. R. Morgan et al. (1979) Nucleic Acids Res. 7, 547–570.
31. M. J. Waring (1965) J. Mol. Biol. 13, 269–282.
32. E. F. Gale et al. (1981). The Molecular Basis of Antibiotic Action, Wiley, London.
33. F. M. Pohl, T. M. Jovin, W. Baehr, and J. J. Holbrook (1972) Proc. Natl. Acad. Sci. USA 69, 3805-3809.
34. B. Gaugain et al. (1978) Biochemistry 17, 5071–5078.
35. J. Markovits, B. P. Roques, and J. B. L. Pecq (1979) Anal. Biochem. 94, 259–264.
3. A. N. Glazer, K. Peck, and R. A. Mathies (1990) Proc. Natl. Acad. Sci. USA 87, 3851–3855.
37. H. S. Rye et al. (1992) Nucleic Acids Res. 20, 2803–2812.
38. H. S. Rye, B. L. Drees, H. M. N. Nelson, and A. N. Glazer (1993) J. Biol. Chem. 268, 25229–25238.


|
|
|
|
علامات بسيطة في جسدك قد تنذر بمرض "قاتل"
|
|
|
|
|
|
|
أول صور ثلاثية الأبعاد للغدة الزعترية البشرية
|
|
|
|
|
|
|
مكتبة أمّ البنين النسويّة تصدر العدد 212 من مجلّة رياض الزهراء (عليها السلام)
|
|
|