تاريخ الفيزياء

علماء الفيزياء


الفيزياء الكلاسيكية

الميكانيك

الديناميكا الحرارية


الكهربائية والمغناطيسية

الكهربائية

المغناطيسية

الكهرومغناطيسية


علم البصريات

تاريخ علم البصريات

الضوء

مواضيع عامة في علم البصريات

الصوت


الفيزياء الحديثة


النظرية النسبية

النظرية النسبية الخاصة

النظرية النسبية العامة

مواضيع عامة في النظرية النسبية

ميكانيكا الكم

الفيزياء الذرية

الفيزياء الجزيئية


الفيزياء النووية

مواضيع عامة في الفيزياء النووية

النشاط الاشعاعي


فيزياء الحالة الصلبة

الموصلات

أشباه الموصلات

العوازل

مواضيع عامة في الفيزياء الصلبة

فيزياء الجوامد


الليزر

أنواع الليزر

بعض تطبيقات الليزر

مواضيع عامة في الليزر


علم الفلك

تاريخ وعلماء علم الفلك

الثقوب السوداء


المجموعة الشمسية

الشمس

كوكب عطارد

كوكب الزهرة

كوكب الأرض

كوكب المريخ

كوكب المشتري

كوكب زحل

كوكب أورانوس

كوكب نبتون

كوكب بلوتو

القمر

كواكب ومواضيع اخرى

مواضيع عامة في علم الفلك

النجوم

البلازما

الألكترونيات

خواص المادة


الطاقة البديلة

الطاقة الشمسية

مواضيع عامة في الطاقة البديلة

المد والجزر

فيزياء الجسيمات


الفيزياء والعلوم الأخرى

الفيزياء الكيميائية

الفيزياء الرياضية

الفيزياء الحيوية

الفيزياء العامة


مواضيع عامة في الفيزياء

تجارب فيزيائية

مصطلحات وتعاريف فيزيائية

وحدات القياس الفيزيائية

طرائف الفيزياء

مواضيع اخرى
Broadband spectral photometry
المؤلف:
A. Roy, D. Clarke
المصدر:
Astronomy - Principles and Practice 4th ed
الجزء والصفحة:
p 306
25-8-2020
1692
Broadband spectral photometry
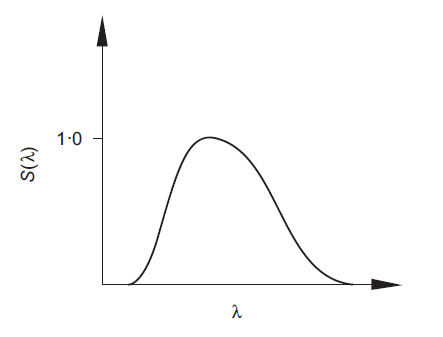
The response of any detector system to energy falling on to it obviously depends on the strength of the radiation received. It also depends on the frequency distribution of the energy and on the spectral sensitivity of the detector. In many instruments, rather than using the full spectral range of the detector, optical elements, such as colour filters, may be applied to select specific spectral zones for measurement. The variation with wavelength of the relative response of the system may be written as S(λ) and may be displayed graphically (see figure 1). The width of the embraced spectrum, Δλ, may be defined as the spectral interval between points on the S(λ) curve where the response is reduced to a half of the maximum value and this is termed the full-width half maximum or FWHM. Each passband can be ascribed an equivalent wavelength, λ0, defined by

this being the mean wavelength, weighted according to the response curve. To a first order, brightness measurements made using passbands which are narrow in comparison to the broader energy spectrum of a source can be considered as the monochromatic brightness value at the equivalent wavelength.

Figure 1. An example of the relative spectral response of a detector system normalized so that its maximum
equals unity.
Let us suppose that we have been given some equipment and we use it to measure the brightnesses of stars. By defining a standard star, or a set of standard stars (see discussion relating to Pogson’s relationships, a magnitude scale can be set up and by comparing the response of the system to the standard star and all of the stars in turn, each star can be assigned a magnitude. If the same stars now have their brightnesses measured by a second detector system, providing a different passband and different equivalent wavelength, it will be found, in general, that the stars do not appear on this second scale at the identical positions at which they appeared on the first scale. This is a reflection of the fact that each star has an energy envelope defined by its temperature and that the signal from the detector is a function of the amount of energy that falls on it within the spectral range to which it responds. Thus, each detector system has its own magnitude scale.
 الاكثر قراءة في مواضيع عامة في علم الفلك
 اخر الاخبار
اخبار العتبة العباسية المقدسة

الآخبار الصحية


 قسم الشؤون الفكرية يصدر كتاباً يوثق تاريخ السدانة في العتبة العباسية المقدسة
 "المهمة".. إصدار قصصي يوثّق القصص الفائزة في مسابقة فتوى الدفاع المقدسة للقصة القصيرة
 (نوافذ).. إصدار أدبي يوثق القصص الفائزة في مسابقة الإمام العسكري (عليه السلام)


