الوضع الليلي


 3:46:47
  2024-07-30
  2026
2026
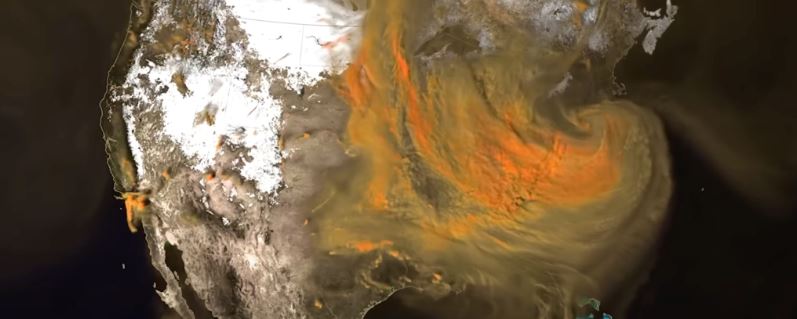
Our CO2 emissions are warming the planet and making life uncomfortable and even unbearable in some regions. In July, the planet set consecutive records for the hottest day.
NASA is mapping our emissions, and while what they show us isn't uplifting, it is visually appealing in a ghoulish way. Maybe the combination of visual appeal and ghoulishness will build momentum in the fight against climate change.
NASA's Scientific Visualization Studio has released a video showing how wind and air currents pushed CO2 emissions around Earth's atmosphere from January to March 2020. The video's high-resolution zooms in and sees individual sources of CO2, including power plants and forest fires.
"As policymakers and as scientists, we're trying to account for where carbon comes from and how that impacts the planet," said climate scientist Lesley Ott at NASA's Goddard Space Flight Center in Greenbelt, Maryland. "You see here how everything is interconnected by these different weather patterns."
The video starkly shows that it doesn't matter where CO2 emissions come from; we all deal with the outcomes. Yet there are some interesting global differences.
Above the USA, South Asia, and China, most of the carbon comes from industry, power plants, and transportation. But over Africa and South America, most of the emissions come from burning, including forest fires, agricultural burning, and land clearing. Emissions also come from fossil fuels like oil and coal.
The image pulses for a couple of reasons. Forest fires tend to flare during the day and then slow down at night. Also, trees and plants photosynthesize during the day, releasing oxygen and absorbing CO2. The land masses and the oceans act as carbon sinks.
There's more pulsing in South America and the tropics because the data was collected during their growing season.
In this version, the video zooms in on the USA, showing individual CO2 sources.
These visualizations are based on GEOS, the Goddard Earth Observing System. GEOS is an integrated system for modelling Earth's coupled atmosphere, ocean, and land systems.
NASA calls it a "high-resolution weather analysis model," and it uses supercomputers to show what's happening in the atmosphere.
GEOS is based on billions of data points, including data from the Terra satellite's MODIS and the Suomi-NPP satellite's VIIRS instruments. GEOS has a resolution that's more than 100 times greater than typical weather models.
Reality Of Islam |
|

After spend

A study of

Researchers
 9:3:43
2018-11-05
9:3:43
2018-11-05
10 benefits of Marriage in Islam
7:5:22
2019-04-08
benefits of reciting surat yunus, hud &
9:45:7
2018-12-24
advantages & disadvantages of divorce
11:35:12
2018-06-10
6:0:51
2018-10-16
8:25:12
2022-03-09
10:55:53
2022-06-13
2:42:26
2023-02-02
7:6:7
2022-03-21
4:2:19
2022-10-10
5:57:34
2023-03-18
8:4:21
2022-01-08
5:41:46
2023-03-18
| LATEST |
 HOME
HOME