Equipotential Plot
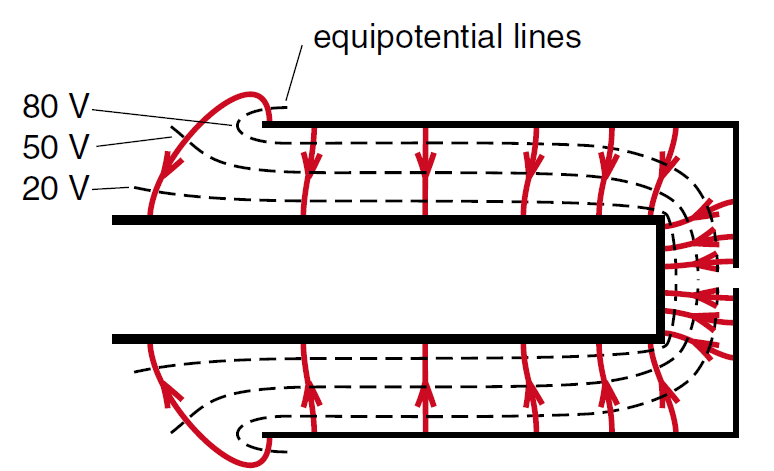
Once we know the field lines, we can plot the equipotential lines as shown in Figure (1). The lines are labeled assuming that the filament is grounded (0 volts) and that the cap is at 100 volts . The shape of the equipotentials, shown by dashed lines, does not change when we use different accelerating voltages, only the numerical value of the equipotentials changes.
The reason that the equipotential lines are of such interest in Figure (1) is that they can also be viewed as a map of the electron’s kinetic energy. Remember that the voltage V is the potential energy of a unit positive test charge. A charge q has a potential energy qV, and an electron, with a charge – e , has an electric potential energy – e V.
In our electron gun, the electrons evaporate from the filament with very little kinetic energy, call it zero. By the time the electrons get to the 10-volt equipotential, their electric potential energy has dropped to (–e×10) joules, and by conservation of energy, their kinetic energy has gone up to (+e×10) joules. At the 50 volt equipotential the electron’s kinetic energy has risen to (e×50) joules, and when the electrons reach the 100 volt cap, their energy is up to (e×100) joules. Thus the equipotential lines in Figure (1) provide a map of the kinetic energy of the electrons.

Figure 1: Equipotential plot. We see that by the time the electrons have reached the hole in the cap, they have crossed the same equipotential lines and therefore have gained as much kinetic energy as the electrons that strike the cap. (From a student project by Daniel Leslie and Elad Levy.)
 الاكثر قراءة في الكهربائية
 اخر الاخبار
اخبار العتبة العباسية المقدسة


