آخر المواضيع المضافة

 تاريخ الرياضيات
الرياضيات في الحضارات المختلفة
الرياضيات المتقطعة
الجبر
الهندسة
المعادلات التفاضلية و التكاملية
التحليل
علماء الرياضيات
تاريخ الرياضيات
الرياضيات في الحضارات المختلفة
الرياضيات المتقطعة
الجبر
الهندسة
المعادلات التفاضلية و التكاملية
التحليل
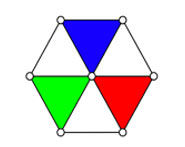
علماء الرياضيات | Contour Plot |


|
|
Read More
Date: 30-11-2021
Date: 18-9-2021
Date: 30-8-2021
|
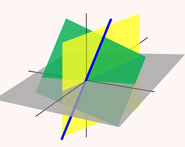
A plot of equipotential curves. If desired, the regions between contours can be shaded or colored to indicate their magnitude. Contour plots are implemented in the Wolfram Language as ContourPlot[f,  x, xmin, xmax
 ,
,  y, ymin, ymax
 ].
].
REFERENCES:
Anton, H. Calculus: A New Horizon, 6th ed. New York: Wiley, pp. 870 and 872, 1984.
|
|
|
|
للعاملين في الليل.. حيلة صحية تجنبكم خطر هذا النوع من العمل
|
|
|
|
|
|
|
"ناسا" تحتفي برائد الفضاء السوفياتي يوري غاغارين
|
|
|
|
|
|
|
نحو شراكة وطنية متكاملة.. الأمين العام للعتبة الحسينية يبحث مع وكيل وزارة الخارجية آفاق التعاون المؤسسي
|
|
|