آخر المواضيع المضافة

 تاريخ الرياضيات
الرياضيات في الحضارات المختلفة
الرياضيات المتقطعة
الجبر
الهندسة
المعادلات التفاضلية و التكاملية
التحليل
علماء الرياضيات
تاريخ الرياضيات
الرياضيات في الحضارات المختلفة
الرياضيات المتقطعة
الجبر
الهندسة
المعادلات التفاضلية و التكاملية
التحليل
علماء الرياضيات | Mode |


|
|
Read More
Date: 21-3-2021
Date: 7-2-2021
Date: 11-2-2021
|
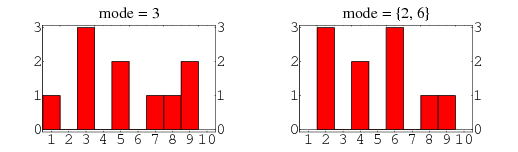
The mode of a set of observations is the most commonly occurring value. For example, for a data set (3, 7, 3, 9, 9, 3, 5, 1, 8, 5) (left histogram), the unique mode is 3. Similarly, for a data set (2, 4, 9, 6, 4, 6, 6, 2, 8, 2) (right histogram), there are two modes: 2 and 6. A distribution with a single mode is said to be unimodal. A distribution with more than one mode is said to be bimodal, trimodal, etc., or in general, multimodal. The mode of a set of data is implemented in the Wolfram Language as Commonest[data].
An interesting empirical relationship between the sample mean, statistical median, and mode which appears to hold for unimodal curves of moderate asymmetry is given by
 |
(Kenney and Keeping 1962, p. 53), which is the basis for the definition of the Pearson mode skewness.
REFERENCES:
Kenney, J. F. and Keeping, E. S. "The Mode," "Relation Between Mean, Median, and Mode," and "Relative Merits of Mean, Median, and Mode." §4.7-4.9 in Mathematics of Statistics, Pt. 1, 3rd ed. Princeton, NJ: Van Nostrand, pp. 50-54, 1962.
Zwillinger, D. (Ed.). CRC Standard Mathematical Tables and Formulae. Boca Raton, FL: CRC Press, p. 602, 1995.
|
|
|
|
التوتر والسرطان.. علماء يحذرون من "صلة خطيرة"
|
|
|
|
|
|
|
مرآة السيارة: مدى دقة عكسها للصورة الصحيحة
|
|
|
|
|
|
|
نحو شراكة وطنية متكاملة.. الأمين العام للعتبة الحسينية يبحث مع وكيل وزارة الخارجية آفاق التعاون المؤسسي
|
|
|