

 الفيزياء الكلاسيكية
 الكهربائية والمغناطيسية
 علم البصريات
 الفيزياء الحديثة
 النظرية النسبية
 الفيزياء النووية
 فيزياء الحالة الصلبة
 الليزر
 علم الفلك
 المجموعة الشمسية
 الطاقة البديلة
 الفيزياء والعلوم الأخرى
 مواضيع عامة في الفيزياء
|
Read More
Date: 24-1-2017
Date: 2-9-2020
Date: 12-7-2020
|
The photomultiplier: Photon-counting photometry
The current which is measured by DC amplification represents the average flow of electrons from the anode of the photomultiplier. The flow is made up of bursts or pulses of electrons, each one being the result of the liberation of a single photoelectron from the cathode. These pulses can be seen easily if the output from a photomultiplier is fed to an oscilloscope. Since the number of primary photoelectrons is directly proportional to the intensity falling on to the photocathode, so will be the number of pulses which is available at the anode. Hence, by measuring the rate at which the pulses appear or by counting the number of pulses in a given time, the intensity of the radiation can be determined. Since the output is digital, it is already in suitable form for acceptance by computer. Each of the pulses carries a quantity of charge which is given simply by the gain of the detector.
They behave as if generated across a capacitance and given by the stray capacitance of the cables: the lower this is, the higher is the voltage of the pulse. Hence, the voltage of the pulses may be estimated as follows. Using the value of the charge of a single electron and assuming the value of 107 for the gain of the photomultiplier, the charge carried by each pulse is given by
1·6 × 10−19 × 107 = 1·6 × 10−12 C.
Now the voltage, V, across a capacitance, C, when holding a charge, Q, is given by

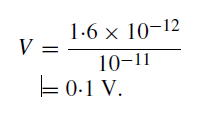
If the stray capacitance can be held to a value as low as 10−11 farad (10 picofarad), then the voltage appearing across it is given by

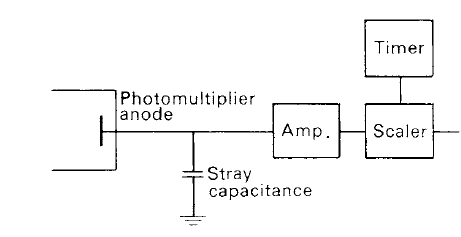
A further amplification, by means of a wide-band amplifier, is, therefore, normally required before the pulses can be counted by a scaler (see figure 1). It must also be remembered that the production of secondary electrons by the dynodes is a statistical process and that there is a range in the voltage heights of the pulses.
Photon-counting photometry lends itself to immediate assessments of the quality of any data. Successive counts over a fixed integration time will be distributed about some mean value, the photon count rate being subject to a noise sometimes referred to as shot noise. The distribution of values can be checked against that predicted by the statistics of photon counting. If the match is good, then the observations are at the limit of the best possible accuracy, with no other noise sources degrading the measurements. Under this circumstance, the fractional uncertainty (the inverse of the signal-to-noise ratio) of any photometric measurement is given by


Figure1. A simple pulse counting photometer.
Hence, any record may be expressed as  . It is easily seen, therefore, that if measurements with an accuracy of 1% are planned, it is necessary only to choose an integration time which provides a total count of N > 104; and this will depend on the brightness of the object and the aperture of the telescope. Higher accuracies can be achieved by recording greater total counts.


|
|
|
|
التوتر والسرطان.. علماء يحذرون من "صلة خطيرة"
|
|
|
|
|
|
|
مرآة السيارة: مدى دقة عكسها للصورة الصحيحة
|
|
|
|
|
|
|
نحو شراكة وطنية متكاملة.. الأمين العام للعتبة الحسينية يبحث مع وكيل وزارة الخارجية آفاق التعاون المؤسسي
|
|
|