Phonetics – the manifestation of language sound
 المؤلف:
David Odden
 المصدر:
Introducing Phonology
 الجزء والصفحة:
2-1
 23-3-2022
 1155
1155
Phonetics – the manifestation of language sound
Ashby and Maidment (2005) provide a detailed introduction to the subject area of phonetics, which you should read for greater detail on the acoustic and articulatory properties of language sounds, and transcription using the International Phonetic Alphabet (IPA). This section provides a basic overview of phonetics, to clarify what phonology is about.
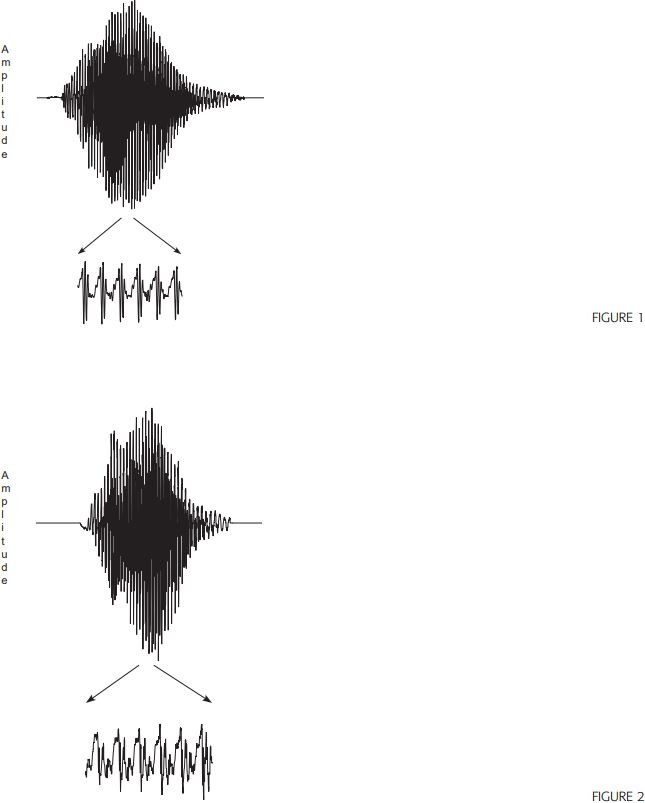
From the phonetic perspective, “sound” refers to mechanical pressure waves and the sensations arising when such a pressure wave strikes your ear. In a physical sound, the wave changes continuously, and can be graphed as a waveform showing the amplitude on the vertical axis and time on the horizontal axis. Figure 1 displays the waveform of a pronunciation of the word wall, with an expanded view of the details of the waveform at the center of the vowel between w and ll.

Figure 2 provides an analogous waveform of a pronunciation of the word ‘will’, which differs from wall just in the choice of the vowel.
Inspection of the expanded view of the vowel part of these waveforms shows differences in the overall shape of the time-varying waveforms, which is what makes these words sound different.
It is difficult to characterize those physical differences from the waveform, but an analytical tool of phonetics, the spectrogram, provides a useful way to describe the differences, by reducing the absolute amplitude properties of a wave at an exact time to a set of (less precise) amplitude characteristics in different frequency and time areas. In a spectrogram, the vertical axis represents frequency in Hertz (Hz) and darkness represents amplitude. Comparing the spectrograms of wall and will in figure 3, you can see that there are especially dark bands in the lower part of the spectrogram, and the frequency at which these bands occur – known as formants – is essential to physically distinguishing the vowels of these two words. Formants are numbered from the bottom up, so the first formant is at the very bottom.

In wall the first two formants are very close together and occur at 634 Hz and 895 Hz, whereas in will they are far apart, occurring at 464 Hz and 1766 Hz. The underlying reason for the difference in these sound qualities is that the tongue is in a different position during the articulation of these two vowels. In the case of the vowel of wall, the tongue is relatively low and retracted, and in the case of will, the tongue is relatively fronted and raised. These differences in the shape of the vocal tract result in different physical sounds coming out of the mouth.
The physical sound of a word’s pronunciation is highly variable, as we see when we compare the spectrograms of three pronunciations of wall in figure 4: the three spectrograms are obviously different.
The first two pronunciations are produced at different times by the same speaker, differing slightly in where the first two formants occur (634 Hz and 895 Hz for the first token versus 647 Hz and 873 Hz for the second), and in numerous other ways such as the greater amplitude of the lower formants in the first token. In the third token, produced by a second (male) speaker of the same dialect, the first two formants are noticeably lower and closer together, occurring at 541 Hz and 617 Hz.

Physical variation in sound also arises because of differences in surrounding context. Figure 5 gives spectrograms of the words wall, tall, and lawn, with grid lines to identify the portion of each spectrogram in the middle which corresponds to the vowel.
In wall, the frequency of the first two formants rapidly rises at the beginning and falls at the end; in tall, the formant frequencies start higher and fall slowly; in lawn, the formants rise slowly and do not fall at the end. A further important fact about physical sound is that it is continuous, so while wall, tall, and lawn are composed of three sounds where the middle sound in each word is the same one, there are no actual physical boundaries between the vowel and the surrounding consonants.
The tools of phonetic analysis can provide very detailed and precise information about the amplitude, frequency and time characteristics of an utterance – a typical spectrogram of a single-syllable word in English could contain around 100,000 bits of information. The problem is that this is too much information – a lot of information needs to be discarded to get at something more general and useful.
 الاكثر قراءة في Phonetics
 اخر الاخبار
اخبار العتبة العباسية المقدسة


