تاريخ الرياضيات

الاعداد و نظريتها
تاريخ التحليل
تار يخ الجبر
الهندسة و التبلوجي
الرياضيات في الحضارات المختلفة
العربية
اليونانية
البابلية
الصينية
المايا
المصرية
الهندية
الرياضيات المتقطعة
المنطق
اسس الرياضيات
فلسفة الرياضيات
مواضيع عامة في المنطق
الجبر
الجبر الخطي
الجبر المجرد
الجبر البولياني
مواضيع عامة في الجبر
الضبابية
نظرية المجموعات
نظرية الزمر
نظرية الحلقات والحقول
نظرية الاعداد
نظرية الفئات
حساب المتجهات
المتتاليات-المتسلسلات
المصفوفات و نظريتها
المثلثات
الهندسة
الهندسة المستوية
الهندسة غير المستوية
مواضيع عامة في الهندسة
التفاضل و التكامل
المعادلات التفاضلية و التكاملية
معادلات تفاضلية
معادلات تكاملية
مواضيع عامة في المعادلات
التحليل
التحليل العددي
التحليل العقدي
التحليل الدالي
مواضيع عامة في التحليل
التحليل الحقيقي
التبلوجيا
نظرية الالعاب
الاحتمالات و الاحصاء
نظرية التحكم
بحوث العمليات
نظرية الكم
الشفرات
الرياضيات التطبيقية
نظريات ومبرهنات
علماء الرياضيات
500AD
500-1499
1000to1499
1500to1599
1600to1649
1650to1699
1700to1749
1750to1779
1780to1799
1800to1819
1820to1829
1830to1839
1840to1849
1850to1859
1860to1864
1865to1869
1870to1874
1875to1879
1880to1884
1885to1889
1890to1894
1895to1899
1900to1904
1905to1909
1910to1914
1915to1919
1920to1924
1925to1929
1930to1939
1940to the present
علماء الرياضيات
الرياضيات في العلوم الاخرى
بحوث و اطاريح جامعية
هل تعلم
طرائق التدريس
الرياضيات العامة
نظرية البيان

Graphs
 المؤلف:
Tony Crilly
المؤلف:
Tony Crilly
 المصدر:
50 mathematical ideas you really need to know
المصدر:
50 mathematical ideas you really need to know
 الجزء والصفحة:
170-175
الجزء والصفحة:
170-175
 23-2-2016
 2196
2196


+
-
20
There are two types of graphs in mathematics. At school we draw curves which show the relationship between variables x and y. In the other more recent sort, dots are joined up by wiggly lines.
Königsberg is a city in East Prussia famous for the seven bridges which cross the River Pregel. Home to the illustrious philosopher Immanuel Kant, the city and its bridges are also linked with the famous mathematician Leonhard Euler.

In the 18th century a curious question was posed: was it possible to set off and walk around Königsberg crossing each bridge exactly once? The walk does not require us to finish where we started – only that we cross each bridge once.
In 1735, Euler presented his solution to the Russian Academy, a solution which is now seen as the beginning of modern graph theory. In our semi-abstract diagram, the island in the middle of the river is labelled I and the banks of the river by A, B and C. Can you plan a walk for a Sunday afternoon that crosses each bridge just once? Pick up a pencil and try it. The key step is to peel away the semi-abstractness and progress to complete abstraction. In so doing a graph of points and lines is obtained. The land is represented by ‘points’ and the bridges joining them are represented by ‘lines’. We don’t care that the lines are not straight or that they differ in length. These things are unimportant. It is only the connections that matter.
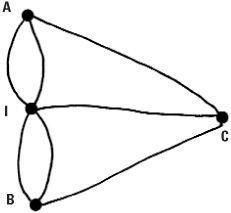
Euler made an observation about a successful walk. Apart from the beginning and the end of the walk, every time a bridge is crossed onto a piece of land it must be possible to leave it on a bridge not previously walked over.
Translating this thought into the abstract picture, we may say that lines meeting at a point must occur in pairs. Apart from two points representing the start and finish of the walk, the bridges can be traversed if and only if each point has an even number of lines incident on it.
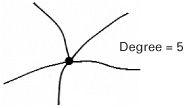
The number of lines meeting at a point is called the ‘degree’ of the point.
Euler’s theorem states that
The bridges of a town or city may be traversed exactly once if, apart from at most two, all points have even degree.
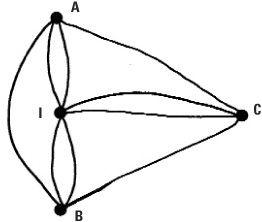
Looking at the graph representing Königsberg, every point is of odd degree. This means that a walk crossing each bridge only once is not possible in Königsberg. If the bridge setup were changed then such a walk may become possible. If an extra bridge were built between the island I and C the degrees at I and C would both be even. This means we could begin a walk on A and end on B having walked over every bridge exactly once. If yet another bridge were built, this time between A and B (shown right), we could start anywhere and finish at the same place because every point would have even degree in this case.
The hand-shaking theorem
If we were asked to draw a graph that contained three points of odd degree, we would have a problem. Try it. It cannot be done because
In any graph the number of points with odd degree must be an even number.
This is the hand-shaking theorem – the first theorem of graph theory. In any graph every line has a beginning and an end, or in other words it takes two people to shake hands. If we add up the degrees of every point for the whole graph we must get an even number, say N. Next we say there are x points with odd degree and y points with even degree. Adding all the degrees of the odd points together we’ll have Nx and adding all the degrees of the even points will give us Ny, which is even. So we have Nx + Ny = N, and therefore Nx = N – Ny. It follows that Nx is even. But x itself cannot be odd because the addition of an odd number of odd degrees would be an odd number. So it follows that x must be even.
Non-planar graphs
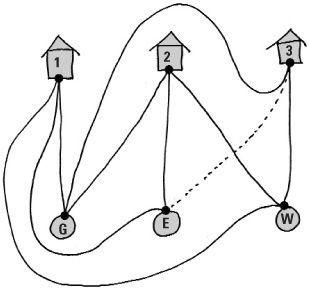
The utilities problem is an old puzzle. Imagine three houses and three utilities – gas, electricity and water. We have to connect each of the houses to each of the utilities, but there’s a catch – the connections must not cross.
In fact this cannot be done – but you might try it out on your unsuspecting friends. The graph described by connecting three points to another three points in all possible ways (with only nine lines) cannot be drawn in the plane without crossings. Such a graph is called non-planar. This utilities graph, along with the graph made by all lines connecting five points, has a special place in graph theory. In 1930, the Polish mathematician Kazimierz Kuratowski proved the startling theorem that a graph is planar if and only if it does not contain either one of these two as a subgraph, a smaller graph contained within the main one.
Trees
A ‘tree’ is a particular kind of graph, very different from the utitlities graph or the Königsberg graph. In the Königsberg bridge problem there were opportunities for starting at a point and returning to it via a different route. Such a route from a point and back to itself is called a cycle. A tree is a graph which has no cycles.
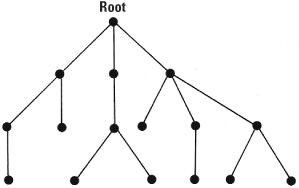
A familiar example of a tree graph is the way directories are arranged in computers. They are arranged in a hierarchy with a root directory and subdirectories leading off it. Because there are no cycles there is no way to cross from one branch other than through the root directory – a familiar manoeuvre for computer users.
Counting trees
How many different trees can be made from a specific number of points? The problem of counting trees was tackled by the 19th-century English mathematician Arthur Cayley. For example, there are exactly three different tree types with five points:
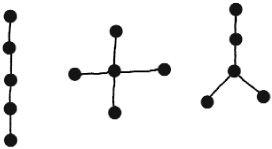
Cayley was able to count the number of different tree types for small numbers of points. He was able to go as far as trees with fewer than 14 points before the sheer computational complexity was too much for a man without a computer. Since then the calculations have advanced as far as trees with as many as 22 points. There are millions of possible types for these.
Even in its own time, Cayley’s research had practical applications. Counting trees is relevant in chemistry, where the distinctiveness of some compounds depends on the way atoms are arranged in their molecules. Compounds with the same number of atoms but with different arrangements have different chemical properties. Using his analysis it was possible to predict the existence of chemicals ‘at the tip of his pen’ that were subsequently found in the laboratory.
the condensed idea
Across the bridges and into the trees

 الاكثر قراءة في هل تعلم
 اخر الاخبار
اخبار العتبة العباسية المقدسة

الآخبار الصحية


 قسم الشؤون الفكرية يصدر كتاباً يوثق تاريخ السدانة في العتبة العباسية المقدسة
 "المهمة".. إصدار قصصي يوثّق القصص الفائزة في مسابقة فتوى الدفاع المقدسة للقصة القصيرة
 (نوافذ).. إصدار أدبي يوثق القصص الفائزة في مسابقة الإمام العسكري (عليه السلام)