pH Titration Curves
 المؤلف:
Jerome L. Rosenberg and Lawrence M. Epstein
 المصدر:
College Chemistry
 الجزء والصفحة:
p 121
 19-7-2017
 2544
2544
pH Titration Curves
Acid solutions are often analyzed by titration with a solution of a strong base of known concentration; similarly, solutions of bases are analyzed by titration with a strong acid. In either case, the measured pH is plotted as a function of the titrant volume. Calculation of a pH titration curve is a particularly good introduction to acid-base equilibrium calculations since a variety of calculations are involved.
Example
Compute the pH vs. volume curve for the titration of 10.0 mL of 0.25 M HCl with 0.10 M NaOH.
Since HCl and NaOH are completely dissociated in dilute solutions, and the reaction goes to completion, this is really a simple stoichiometry problem in which we convert the H3O+ concentration to pH. If the initial number of millimoles of HCl is

then, before complete neutralization [H3O+] after the addition of V mL of NaOH solution is

We set up a table for several volumes of NaOH added:

When we add exactly 25.00 mL of NaOH, all the H3O+ from the HCl has been consumed—the equivalence point. The solution then contains NaCl, and, since Na+ and Cl- are neither acidic or basic, the H3O+ concentration is due to water ionization alone and pH = 7.00. Beyond the equivalence point, the solution will contain excess OH-, the concentration of which is

and the pH is computed as pH = 14.00 - log[OH-]. Continuing the table for two more points:

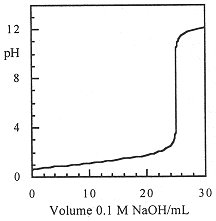
These points (and a few more) are plotted in Figure 1.1.

Figure 1.1. pH titration curve for titration of 10 mL of 0.25 M HCl with 0.10 M NaOH.
 الاكثر قراءة في مواضيع عامة في الكيمياء التحليلية
 اخر الاخبار
اخبار العتبة العباسية المقدسة


