Types of Errors in Experimental Data
 المؤلف:
D. A. Skoog, F. J.Holler, D M. West, and S. R. Crouch
 المصدر:
Fundamentals of Analytical Chemistry
 الجزء والصفحة:
9th. p 86
 20-4-2017
 2856
2856
Types of Errors in Experimental Data
The precision of a measurement is readily determined by comparing data from carefully replicated experiments. Unfortunately, an estimate of the accuracy is not as easy to obtain. To determine the accuracy, we have to know the true value, which is usually what we are seeking in the analysis.

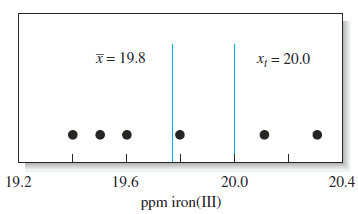
Figure 5-1 Results from six replicate determinations of iron in aqueous samples of a standard solution containing 20.0 ppm iron(III). The mean value of 19.78 has been rounded to 19.8 ppm.
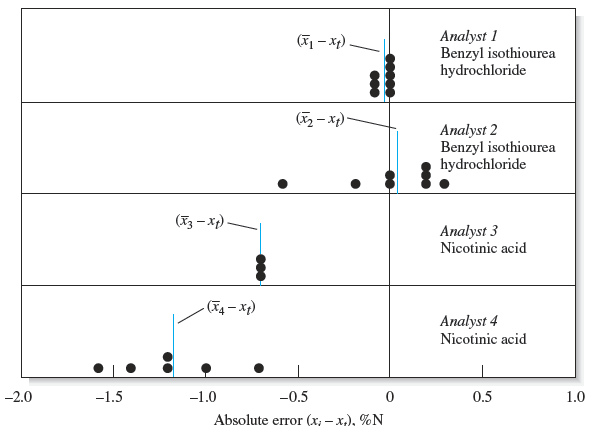
Results can be precise without being accurate and accurate without being precise. The danger of assuming that precise results are also accurate is illustrated in Figure 5-3, which summarizes the results for the determination of nitrogen in two pure compounds. The dots show the absolute errors of replicate results obtained by four analysts. Note that analyst 1 obtained relatively high precision and high accuracy.
Analyst 2 had poor precision but good accuracy. The results of analyst 3 are surprisingly common. The precision is excellent, but there is significant error in the numerical average for the data. Both the precision and the accuracy are poor for the results of analyst.

Figure 5-3 Absolute error in the micro-Kjeldahl determination of nitrogen. Each dot represents the error associated with a single determination. Each vertical line labeled (xi 2 xt) is the absolute average deviation of the set from the true value. (Data from C. O. Willits and C. L. Ogg, J. Assoc. Offic. Anal. Chem., 1949, 32, 561.)
Figures 5-1 and 5-3 suggest that chemical analyses are affected by at least two types of errors. One type, called random (or indeterminate) error, causes data to be scattered more or less symmetrically around a mean value. Refer again to Figure 5-3, and notice that the scatter in the data, and thus the random error, for analysts 1 and 3 is significantly less than that for analysts 2 and 4. A second type of error, called systematic (or determinate) error, causes the mean of a data set to differ from the accepted value. For example, the mean of the results in
Figure 5-1 has a systematic error of about 20.2 ppm Fe. The results of analysts 1 and 2 in Figure 5-3 have little systematic error, but the data of analysts 3 and 4 show systematic errors of about 20.7 and 21.2% nitrogen. In general, a systematic error in a series of replicate measurements causes all the results to be too high or too low. An example of a systematic error is the loss of a volatile analyte while heating a sample.
A third type of error is gross error. Gross errors differ from indeterminate and determinate errors. They usually occur only occasionally, are often large, and may cause a result to be either high or low. They are often the product of human errors.
For example, if part of a precipitate is lost before weighing, analytical results will be low. Touching a weighing bottle with your fingers after its empty mass is determined will cause a high mass reading for a solid weighed in the contaminated bottle. Gross errors lead to outliers, results that appear to differ markedly from all other data in a set of replicate measurements. There is no evidence of a gross error in Figure 5-3.
 الاكثر قراءة في مواضيع عامة في الكيمياء التحليلية
 اخر الاخبار
اخبار العتبة العباسية المقدسة


