INFRARED SPECTROSCOPY APPLICATIONS
 المؤلف:
Mark Csele
 المصدر:
FUNDAMENTALS OF LIGHT SOURCES AND LASERS
 الجزء والصفحة:
p77
 9-3-2016
 2359
2359
INFRARED SPECTROSCOPY APPLICATIONS
The most dramatic example of the effect of vibrational energy levels (and evidence of various bond energies) is the application of infrared spectroscopy. This technique allows analysis and identification of complex molecules by their absorption “signature” of wavelengths in the infrared. In this technique, incident infrared energy causes covalent bonds between atoms in molecules to vibrate. Because bonds between atoms of different masses have different spring constants, they vibrate at wavelengths characteristic of the particular chemical bond involved. A single carbon to carbon bond, for example, will vibrate at a different wavelength than a carbon–oxygen bond, so the features of a particular molecule (indeed, the molecule itself) can be identified by the IR absorption spectrum. The carbon– oxygen bond, for example, will always vibrate at the same wavelength, regardless of where the bond is in a given molecule, so the appearance of an absorption peak at a specific wavelength indicates the presence of that bond in a sample molecule.
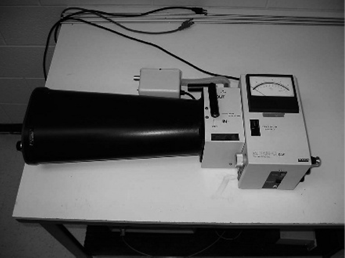
A typical instrument used for such analysis is shown in Figure 1.1, in this case an infrared gas analyzer used to identify an unknown gas (and the concentration of the gas) by its infrared absorption spectrum. Broadband infrared radiation from an

Figure 1.1. Infrared gas analyzer.

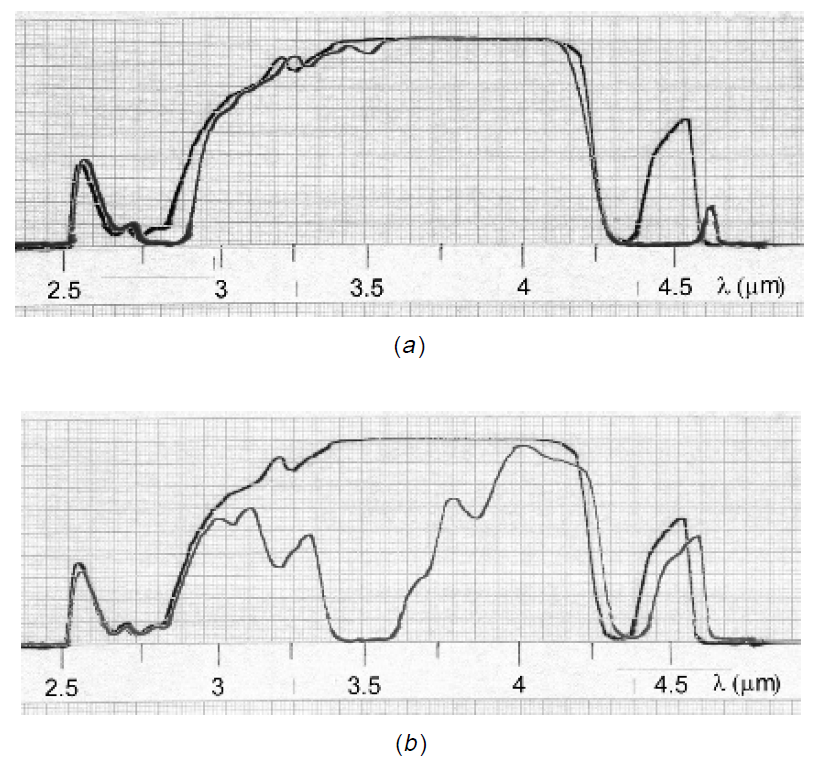
Figure 1.2. Infrared absorption spectrum of CO2 and propane.
internal source is beamed through a cell containing the gas to be analyzed. In this case the gas cell (the large black unit on the left side of the instrument) contains a folded-mirror arrangement yielding a path of 20 m for the radiation. Infrared radiation exiting the cell is then analyzed using an infrared spectrophotometer to determine which wavelengths were absorbed by the molecules of the sample in the cell.
The infrared spectrum between 3 and 7 μm is called the functional group region and is used to identify the type of molecule based on the presence of certain groups of atoms, such as -CH3 ,-CH2 ,-OH, and -NH, as well as doubly and triply bonded carbons. Absorption spectra from this region identify common chemical groups that compose the molecule: for example, all simple alcohols have a similar absorption pattern in this range since they all feature an-OH (oxygen–hydrogen or hydroxyl) group as well as a -CH3 (methyl) group which terminates the molecular chain. Other regions of the spectrum are used to identify the individual molecule based on its individual “fingerprint.”
Consider the infrared absorption spectrum of carbon dioxide (CO2) in the near-IR region of 2.5 to 4.5 μm. Comparing a dilute sample of this gas to the reference spectrum

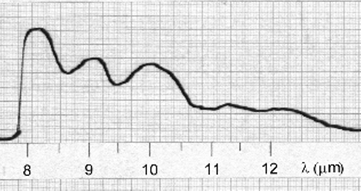
Figure 1.3. Infrared “fingerprint” of propane.
of air in Figure 1.2(a), we find that there are no discernible absorption peaks caused by the sample; in other words, CO2 does not absorb infrared radiation in this band. The reason is that there is only one type of bond in this molecule, a carbon to oxygen double covalent bond, which has an allowed vibrational mode with energies corresponding to wavelengths outside the range we are examining. Contrast this to the absorption spectrum of propane shown in Figure 1.2(b), which reveals a complex structure of absorption wavelengths.
Propane, which has the chemical structure CH3-CH2-CH3 contains numerous features which are evident in this region, including absorption in the area of 3.2 to 3.4 μm, corresponding to carbon–hydrogen bonds in the molecule. Most interesting, perhaps, are sets of absorption “peaks” (which, I suppose, really should be called “valleys”), which correspond to specific functional groups such as the -CH3 and -CH3 groups of which this molecule consists. At this stage we are able to identify component groups; however, for the exact chemical composition, the region to examine is the fingerprint region. In this case the absorption spectrum for propane between 8 and 12 μm (Figure 1.3) reveals a pattern of peaks unique to propane alone.
Simple gas analysis is performed by matching peaks in the sample spectrum to known reference spectra for various gases. Advanced infrared spectroscopy instruments utilize interferometry techniques, combined with Fourier transform mathematics, to yield high resolutions in which closely spaced peaks can be resolved. Aside from an interesting demonstration of molecular energy levels, infrared spectroscopy is an extremely important analytical tool, with uses ranging from forensics to environmental science.
 الاكثر قراءة في مواضيع عامة في الليزر
 اخر الاخبار
اخبار العتبة العباسية المقدسة


