
النبات

مواضيع عامة في علم النبات

الجذور - السيقان - الأوراق

النباتات الوعائية واللاوعائية

البذور (مغطاة البذور - عاريات البذور)

الطحالب

النباتات الطبية


الحيوان

مواضيع عامة في علم الحيوان

علم التشريح

التنوع الإحيائي

البايلوجيا الخلوية


الأحياء المجهرية

البكتيريا

الفطريات

الطفيليات

الفايروسات


علم الأمراض

الاورام

الامراض الوراثية

الامراض المناعية

الامراض المدارية

اضطرابات الدورة الدموية

مواضيع عامة في علم الامراض

الحشرات


التقانة الإحيائية

مواضيع عامة في التقانة الإحيائية


التقنية الحيوية المكروبية

التقنية الحيوية والميكروبات

الفعاليات الحيوية

وراثة الاحياء المجهرية

تصنيف الاحياء المجهرية

الاحياء المجهرية في الطبيعة

أيض الاجهاد

التقنية الحيوية والبيئة

التقنية الحيوية والطب

التقنية الحيوية والزراعة

التقنية الحيوية والصناعة

التقنية الحيوية والطاقة

البحار والطحالب الصغيرة

عزل البروتين

هندسة الجينات


التقنية الحياتية النانوية

مفاهيم التقنية الحيوية النانوية

التراكيب النانوية والمجاهر المستخدمة في رؤيتها

تصنيع وتخليق المواد النانوية

تطبيقات التقنية النانوية والحيوية النانوية

الرقائق والمتحسسات الحيوية

المصفوفات المجهرية وحاسوب الدنا

اللقاحات

البيئة والتلوث


علم الأجنة

اعضاء التكاثر وتشكل الاعراس

الاخصاب

التشطر

العصيبة وتشكل الجسيدات

تشكل اللواحق الجنينية

تكون المعيدة وظهور الطبقات الجنينية

مقدمة لعلم الاجنة


الأحياء الجزيئي

مواضيع عامة في الاحياء الجزيئي


علم وظائف الأعضاء


الغدد

مواضيع عامة في الغدد

الغدد الصم و هرموناتها

الجسم تحت السريري

الغدة النخامية

الغدة الكظرية

الغدة التناسلية

الغدة الدرقية والجار الدرقية

الغدة البنكرياسية

الغدة الصنوبرية

مواضيع عامة في علم وظائف الاعضاء

الخلية الحيوانية

الجهاز العصبي

أعضاء الحس

الجهاز العضلي

السوائل الجسمية

الجهاز الدوري والليمف

الجهاز التنفسي

الجهاز الهضمي

الجهاز البولي


المضادات الميكروبية

مواضيع عامة في المضادات الميكروبية

مضادات البكتيريا

مضادات الفطريات

مضادات الطفيليات

مضادات الفايروسات

علم الخلية

الوراثة

الأحياء العامة

المناعة

التحليلات المرضية

الكيمياء الحيوية

مواضيع متنوعة أخرى

الانزيمات
RNA Polymerase–Promoter and DNA–Protein Interactions Are the Same for Promoter Recognition and DNA Melting
المؤلف:
JOCELYN E. KREBS, ELLIOTT S. GOLDSTEIN and STEPHEN T. KILPATRICK
المصدر:
LEWIN’S GENES XII
الجزء والصفحة:
4-5-2021
2310
RNA Polymerase–Promoter and DNA–Protein Interactions Are the Same for Promoter Recognition and DNA Melting
KEY CONCEPTS
- The consensus sequences at −35 and −10 provide most of the contact points for RNA polymerase in the promoter.
- The points of contact lie primarily on one face of the DNA.
- Melting the double helix begins with base flipping within the promoter.
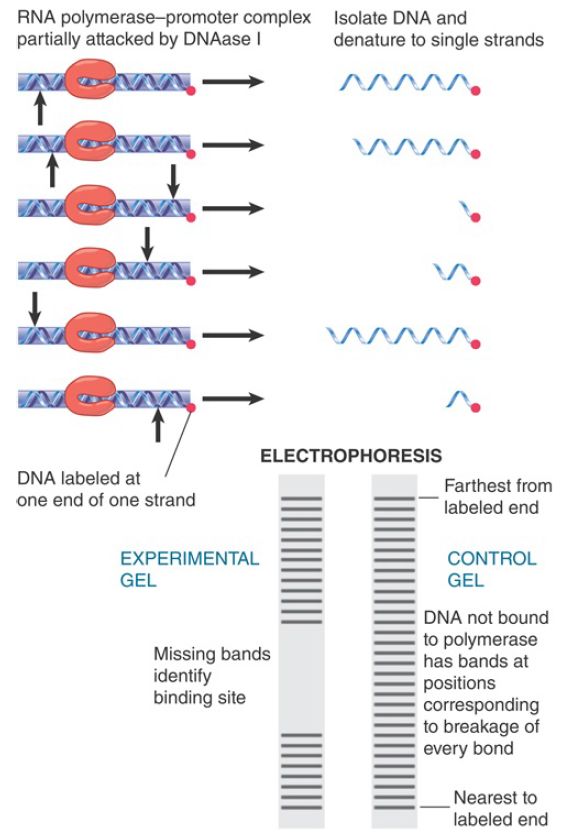
The ability of RNA polymerase (or indeed any protein) to recognize DNA can be characterized by footprinting. A sequence of DNA bound to the protein is partially digested with an endonuclease to attack individual phosphodiester bonds within the nucleic acid.
Under appropriate conditions, any particular phosphodiester bond is broken in some, but not in all, DNA molecules. The positions that are cleaved can be identified by using DNA labeled on one strand at one end only. The principle is the same as that involved in DNA sequencing: Partial cleavage of an end-labeled molecule at a susceptible site creates a fragment of unique length.
FIGURE 1 shows that following the nuclease treatment the broken DNA fragments can be separated by electrophoresis on a gel that separates them according to length. Each fragment that retains a labeled end produces a radioactive band. The position of the band corresponds to the number of bases in the fragment. The shortest fragments move the fastest, so distance from the labeled end is counted up from the bottom of the gel.

FIGURE 1 Footprinting identifies DNA-binding sites for proteins by their protection against nicking.
In free DNA, virtually every susceptible bond position is broken in one or another molecule. Figure 17.20 illustrates that when the DNA is complexed with a protein, the positions covered by the DNA-binding protein are protected from cleavage. Thus, when two reactions are run in parallel—a control DNA in which no protein is present and an experimental mixture containing molecules of DNA bound to the protein—a characteristic pattern emerges. When a bound protein blocks access of the nuclease to DNA, the bonds in the bound sequence fail to be broken in the experimental mixture, and that part of the gel remains unrepresented by labeled DNA fragments.
In the control, virtually every bond is broken, generating a ladder of bands, with one band representing each base. Thirty-one bands are shown in Figure 1. In the protected fragment, bonds cannot be broken in the region bound by the protein, so bands representing fragments of the corresponding sizes are not generated. The absence of bands 9 through 18 in the figure identifies a protein-binding site covering the region located 9 to 18 bases from the labeled end of the DNA. By comparing the control and experimental lanes with a sequencing reaction that is run in parallel, it becomes possible to “read off” the corresponding sequence directly, thus identifying the nucleotide sequence of the binding site.
As described previously , RNA polymerase binds to the promoter region from −55 to +20. The points at which RNA polymerase actually contacts the promoter can be identified by modifying the footprinting technique to treat RNA polymerase–promoter complexes with reagents that modify particular bases. We can then perform the experiment in two ways:
- The DNA can be modified before it is bound to RNA polymerase. In this case, if the modification prevents RNA polymerase from binding, we have identified a base position where contact is essential.
- The RNA polymerase–DNA complex can be modified. We then can compare the pattern of protected bands with that of free DNA and of the unmodified complex. Some bands disappear, thus identifying sites at which the enzyme has protected the promoter against modification. Other bands increase in intensity, thus identifying sites at which the DNA must be held in a conformation in which it is more exposed to the cleaving agent.
These changes in sensitivity revealed the geometry of the complex, as summarized in FIGURE 2, for a typical promoter. The regions at −35 and −10 contain most of the contact points for the
enzyme. Within these regions, the same sets of positions tend both to prevent binding if previously modified, and to show increased or decreased susceptibility to modification after binding. The points of contact do not coincide completely with sites of mutation; however, they occur in the same limited region.

FIGURE 2. One face of the promoter contains the contact points for RNA.
It is noteworthy that the same positions in different promoters provide many of the contact points, even though a different base is present. This indicates that there is a common mechanism for RNA polymerase binding, although the reaction does not depend on the presence of particular bases at some of the points of contact. This model explains why some of the points of contact are not sites of mutation. In addition, not every mutation lies in a point of contact; the mutations may influence the neighborhood without actually being touched by the enzyme.
It is especially significant that the experiments using premodification identify sites in the same region that are protected by the enzyme against subsequent modification. These two experiments measure different things. Premodification identifies all those sites that the enzyme must recognize in order to bind to DNA. Protection experiments recognize all those sites that actually make contact in the binary complex. The protected sites include all the recognition sites and also some additional positions; this suggests that theenzyme first recognizes a set of bases necessary for it to “touch down” and then extends its points of contact to additional bases.
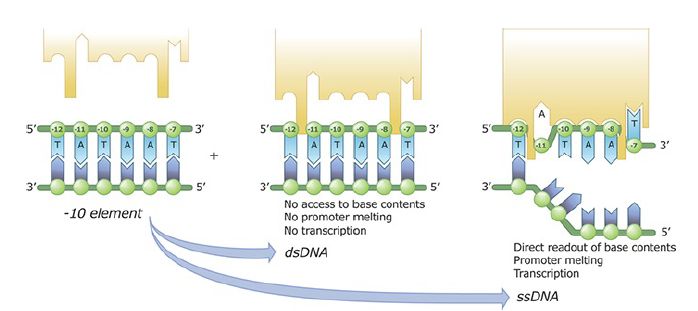
The region of DNA that is unwound in the binary complex can be identified directly by multiple methods. Sigma factor region 2 binds extensively throughout the promoter region to the phosphodiester backbone. Promoter sequence recognition and melting occur concurrently. Melting begins with base flipping, where the two bases A and T are each flipped out of their base-pairing position into pockets in the sigma factor, as shown in FIGURE 3. The pockets are specific for an A11 and a T7. This initiates strand separation and recognizes proper promoter sequence at the same time. The region that subsequently becomes unwound starts at the right end of the −11 sequence and propagates down to just past the start point at +3.

FIGURE 3 Sequence-specific recognition of the −10 element by region 2 of σ. The DNA backbone is represented by green circles, bases of the nontemplate strand by dark blue polygons, and bases of the template strand by light blue polygons. The sequence of the nontemplate strand corresponds to the consensus of the −10 element. Region 2 of σ is shown as an orange polygon.
Data from X. Liu, et al., Cell 147 (2011): 1218–1219.
Viewed in three dimensions, the points of contact upstream of the −10 sequence all lie on one face of DNA. This can be seen in the lower drawing in Figure 2, in which the contact points are marked on a double helix viewed from one side. Most lie on the nontemplate strand. These bases are probably recognized in the initial formation of a closed binary complex. This would make it possible for RNA polymerase to approach DNA from one side and recognize that face of the DNA. As DNA unwinding commences, further sites that originally lay on the other face of DNA can be recognized and bound.
 الاكثر قراءة في مواضيع عامة في الاحياء الجزيئي
 اخر الاخبار
اخبار العتبة العباسية المقدسة

الآخبار الصحية


 قسم الشؤون الفكرية يصدر كتاباً يوثق تاريخ السدانة في العتبة العباسية المقدسة
 "المهمة".. إصدار قصصي يوثّق القصص الفائزة في مسابقة فتوى الدفاع المقدسة للقصة القصيرة
 (نوافذ).. إصدار أدبي يوثق القصص الفائزة في مسابقة الإمام العسكري (عليه السلام)


