علم الكيمياء

تاريخ الكيمياء والعلماء المشاهير
التحاضير والتجارب الكيميائية
المخاطر والوقاية في الكيمياء
اخرى
مقالات متنوعة في علم الكيمياء
كيمياء عامة
الكيمياء التحليلية
مواضيع عامة في الكيمياء التحليلية
التحليل النوعي والكمي
التحليل الآلي (الطيفي)
طرق الفصل والتنقية
الكيمياء الحياتية
مواضيع عامة في الكيمياء الحياتية
الكاربوهيدرات
الاحماض الامينية والبروتينات
الانزيمات
الدهون
الاحماض النووية
الفيتامينات والمرافقات الانزيمية
الهرمونات
الكيمياء العضوية
مواضيع عامة في الكيمياء العضوية
الهايدروكاربونات
المركبات الوسطية وميكانيكيات التفاعلات العضوية
التشخيص العضوي
تجارب وتفاعلات في الكيمياء العضوية
الكيمياء الفيزيائية
مواضيع عامة في الكيمياء الفيزيائية
الكيمياء الحرارية
حركية التفاعلات الكيميائية
الكيمياء الكهربائية
الكيمياء اللاعضوية
مواضيع عامة في الكيمياء اللاعضوية
الجدول الدوري وخواص العناصر
نظريات التآصر الكيميائي
كيمياء العناصر الانتقالية ومركباتها المعقدة
مواضيع اخرى في الكيمياء
كيمياء النانو
الكيمياء السريرية
الكيمياء الطبية والدوائية
كيمياء الاغذية والنواتج الطبيعية
الكيمياء الجنائية
الكيمياء الصناعية
البترو كيمياويات
الكيمياء الخضراء
كيمياء البيئة
كيمياء البوليمرات
مواضيع عامة في الكيمياء الصناعية
الكيمياء الاشعاعية والنووية

pH Titration Curves
 المؤلف:
Jerome L. Rosenberg and Lawrence M. Epstein
المؤلف:
Jerome L. Rosenberg and Lawrence M. Epstein
 المصدر:
College Chemistry
المصدر:
College Chemistry
 الجزء والصفحة:
p 121
الجزء والصفحة:
p 121
 19-7-2017
 2707
2707


+
-
20
pH Titration Curves
Acid solutions are often analyzed by titration with a solution of a strong base of known concentration; similarly, solutions of bases are analyzed by titration with a strong acid. In either case, the measured pH is plotted as a function of the titrant volume. Calculation of a pH titration curve is a particularly good introduction to acid-base equilibrium calculations since a variety of calculations are involved.
Example
Compute the pH vs. volume curve for the titration of 10.0 mL of 0.25 M HCl with 0.10 M NaOH.
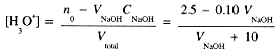
Since HCl and NaOH are completely dissociated in dilute solutions, and the reaction goes to completion, this is really a simple stoichiometry problem in which we convert the H3O+ concentration to pH. If the initial number of millimoles of HCl is

then, before complete neutralization [H3O+] after the addition of V mL of NaOH solution is
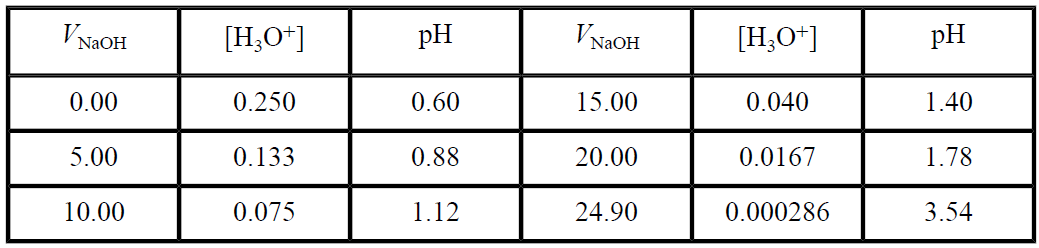
We set up a table for several volumes of NaOH added:
When we add exactly 25.00 mL of NaOH, all the H3O+ from the HCl has been consumed—the equivalence point. The solution then contains NaCl, and, since Na+ and Cl- are neither acidic or basic, the H3O+ concentration is due to water ionization alone and pH = 7.00. Beyond the equivalence point, the solution will contain excess OH-, the concentration of which is
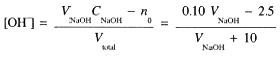
and the pH is computed as pH = 14.00 - log[OH-]. Continuing the table for two more points:
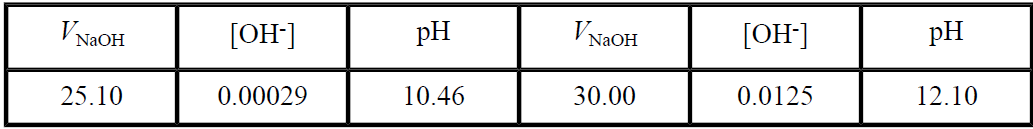
These points (and a few more) are plotted in Figure 1.1.
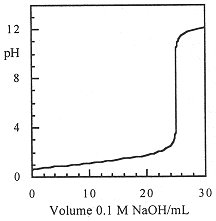
Figure 1.1. pH titration curve for titration of 10 mL of 0.25 M HCl with 0.10 M NaOH.
 الاكثر قراءة في مواضيع عامة في الكيمياء التحليلية
 اخر الاخبار
اخبار العتبة العباسية المقدسة

الآخبار الصحية


مواضيع ذات صلة
 قسم الشؤون الفكرية يصدر كتاباً يوثق تاريخ السدانة في العتبة العباسية المقدسة
 "المهمة".. إصدار قصصي يوثّق القصص الفائزة في مسابقة فتوى الدفاع المقدسة للقصة القصيرة
 (نوافذ).. إصدار أدبي يوثق القصص الفائزة في مسابقة الإمام العسكري (عليه السلام)