علم الكيمياء

تاريخ الكيمياء والعلماء المشاهير
التحاضير والتجارب الكيميائية
المخاطر والوقاية في الكيمياء
اخرى
مقالات متنوعة في علم الكيمياء
كيمياء عامة
الكيمياء التحليلية
مواضيع عامة في الكيمياء التحليلية
التحليل النوعي والكمي
التحليل الآلي (الطيفي)
طرق الفصل والتنقية
الكيمياء الحياتية
مواضيع عامة في الكيمياء الحياتية
الكاربوهيدرات
الاحماض الامينية والبروتينات
الانزيمات
الدهون
الاحماض النووية
الفيتامينات والمرافقات الانزيمية
الهرمونات
الكيمياء العضوية
مواضيع عامة في الكيمياء العضوية
الهايدروكاربونات
المركبات الوسطية وميكانيكيات التفاعلات العضوية
التشخيص العضوي
تجارب وتفاعلات في الكيمياء العضوية
الكيمياء الفيزيائية
مواضيع عامة في الكيمياء الفيزيائية
الكيمياء الحرارية
حركية التفاعلات الكيميائية
الكيمياء الكهربائية
الكيمياء اللاعضوية
مواضيع عامة في الكيمياء اللاعضوية
الجدول الدوري وخواص العناصر
نظريات التآصر الكيميائي
كيمياء العناصر الانتقالية ومركباتها المعقدة
مواضيع اخرى في الكيمياء
كيمياء النانو
الكيمياء السريرية
الكيمياء الطبية والدوائية
كيمياء الاغذية والنواتج الطبيعية
الكيمياء الجنائية
الكيمياء الصناعية
البترو كيمياويات
الكيمياء الخضراء
كيمياء البيئة
كيمياء البوليمرات
مواضيع عامة في الكيمياء الصناعية
الكيمياء التناسقية
الكيمياء الاشعاعية والنووية

Electronic spectra Spectral features
 المؤلف:
CATHERINE E. HOUSECROFT AND ALAN G. SHARPE
المؤلف:
CATHERINE E. HOUSECROFT AND ALAN G. SHARPE
 المصدر:
INORGANIC CHEMISTRY
المصدر:
INORGANIC CHEMISTRY
 الجزء والصفحة:
2th ed p 570
الجزء والصفحة:
2th ed p 570
 14-9-2016
 1585
1585


+
-
20
Electronic spectra Spectral features
A characteristic feature of many d-block metal complexes is their colours, which arise because they absorb light in the visible region (see Figure 20.4). Studies of electronic spectra of metal complexes provide information about structure and bonding, although interpretation of the spectra is not always straightforward. Absorptions arise from transitions between electronic energy levels:
- transitions between metal-centred orbitals possessing dcharacter (‘d–d’ transitions);
- transitions between metal- and ligand-centred MOs which transfer charge from metal to ligand or ligand to metal.
Charge transfer (CT) gives rise to intense absorptions, whereas ‘d–d’ bands are much weaker. In some spectra, CT absorptions mask bands due to ‘d–d’ transitions, although CT absorptions (as well as ligand-centred n–π* and π–π* bands) often occur at higher energies than ‘d–d’ absorptions. MLCT = metal-to-ligand charge transfer LMCT = ligand-to-metal charge transfer
⊽ = 1/λ = v/c
400nm corresponds to 25 000 cm-1; 200nm corresponds to 50 000 cm-1.
Absorption bands in electronic spectra are usually broad; the absorption of a photon of light occurs in ≈10 -18 s whereas molecular vibrations and rotations occur more slowly. Therefore, an electronic transition is a ‘snapshot’ of a molecule in a particular vibrational and rotational state, and it follows that the electronic spectrum will record a range of energies corresponding to different vibrational and rotational states. Absorption bands are described in terms of λmax corresponding to the absorption maximum Amax (Figure 1.1); the wavelength, λmax, is usually given in nm, but the position of the absorption may also be described in terms of wavenumbers, ⊽ (cm-1).
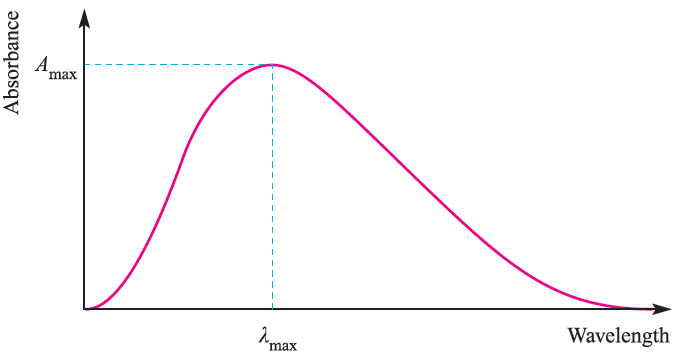
Fig. 1.1 Absorptions in the electronic spectrum of a molecule or molecular ion are often broad, and cover a range of wavelengths. The absorption is characterized by values of λmax and Ԑmax
The molar extinction coefficient (or molar absorptivity) "max of an absorption must also be quoted; Ԑmax indicates how intense an absorption is and is related to Amax by equation 1.1 where c is the concentration of the solution and ℓ is the path length (in cm) of the spectrometer cell.
 (1.1)
(1.1)
Values of Ԑmax range from close to zero (a very weak absorption) to >10 000dm3 mol-1 cm-1 (an intense absorption). Some important points (for which explanations will be given later in the section) are that the electronic spectra of:
- d1, d4, d6 and d9 complexes consist of one absorption;
- d2, d3, d7 and d8 complexes consist of three absorptions;
- d5 complexes consist of a series of very weak, relatively sharp absorptions.
 الاكثر قراءة في كيمياء العناصر الانتقالية ومركباتها المعقدة
 اخر الاخبار
اخبار العتبة العباسية المقدسة

الآخبار الصحية


مواضيع ذات صلة
 قسم الشؤون الفكرية يصدر كتاباً يوثق تاريخ السدانة في العتبة العباسية المقدسة
 "المهمة".. إصدار قصصي يوثّق القصص الفائزة في مسابقة فتوى الدفاع المقدسة للقصة القصيرة
 (نوافذ).. إصدار أدبي يوثق القصص الفائزة في مسابقة الإمام العسكري (عليه السلام)