![]()


تاريخ الرياضيات

الاعداد و نظريتها
تاريخ التحليل
تار يخ الجبر
الهندسة و التبلوجي
الرياضيات في الحضارات المختلفة
العربية
اليونانية
البابلية
الصينية
المايا
المصرية
الهندية
الرياضيات المتقطعة
المنطق
اسس الرياضيات
فلسفة الرياضيات
مواضيع عامة في المنطق
الجبر
الجبر الخطي
الجبر المجرد
الجبر البولياني
مواضيع عامة في الجبر
الضبابية
نظرية المجموعات
نظرية الزمر
نظرية الحلقات والحقول
نظرية الاعداد
نظرية الفئات
حساب المتجهات
المتتاليات-المتسلسلات
المصفوفات و نظريتها
المثلثات
الهندسة
الهندسة المستوية
الهندسة غير المستوية
مواضيع عامة في الهندسة
التفاضل و التكامل
المعادلات التفاضلية و التكاملية
معادلات تفاضلية
معادلات تكاملية
مواضيع عامة في المعادلات
التحليل
التحليل العددي
التحليل العقدي
التحليل الدالي
مواضيع عامة في التحليل
التحليل الحقيقي
التبلوجيا
نظرية الالعاب
الاحتمالات و الاحصاء
نظرية التحكم
بحوث العمليات
نظرية الكم
الشفرات
الرياضيات التطبيقية
نظريات ومبرهنات
علماء الرياضيات
500AD
500-1499
1000to1499
1500to1599
1600to1649
1650to1699
1700to1749
1750to1779
1780to1799
1800to1819
1820to1829
1830to1839
1840to1849
1850to1859
1860to1864
1865to1869
1870to1874
1875to1879
1880to1884
1885to1889
1890to1894
1895to1899
1900to1904
1905to1909
1910to1914
1915to1919
1920to1924
1925to1929
1930to1939
1940to the present
علماء الرياضيات
الرياضيات في العلوم الاخرى
بحوث و اطاريح جامعية
هل تعلم
طرائق التدريس
الرياضيات العامة
نظرية البيان

Sampling
 المؤلف:
W.D. Wallis
المؤلف:
W.D. Wallis
 المصدر:
Mathematics in the Real World
المصدر:
Mathematics in the Real World
 الجزء والصفحة:
66-69
الجزء والصفحة:
66-69
 15-2-2016
 2027
2027


Often collecting all the data from a population is too expensive or too timeconsuming, so we look at part of the whole collection. Sampling is the process for selecting a subset of members of the population. When we do not know some parameter of the population, we plan to use the relevant statistic to estimate the parameter. We want to get a representative sample, so that we can make reliable deductions about the population from the sample. We want to avoid a biased sample, one with some particular trend or tendency. For example, if you want to ask questions about smoking on campus, you would be wrong to base your conclusions on the reactions of a group who were standing outside a building, smoking.
Examples of biased sampling are common. In 1948, the New York Times announced that (Republican candidate) “Thomas E. Dewey’s election as President is a foregone conclusion,” and just before the election, Life Magazine ran a large picture of Dewey with the same sentence as caption. However, polls conducted in country feed stores and small movie theaters predicted Harry S. Truman as an easy winner. Harry S. Truman won the popular vote by more than two million votes and carried 303 electoral votes to Dewey’s 189. The New York Times and Life predictions were based on biased polls.
When the Pacifist Brotherhood of America ran a poll to determine what Americans thought about guns and gun control, the organization was very pleased to find that 95% of those surveyed favored gun control laws. Participants for the survey were chosen from the group’s newsletter mailing list. When the National Rifle Association ran a similar poll, the results were nearly 100% against. The reason for this disparity is easy to see: both organizations took polls of their memberships. Not everyone in the population in question (all adult Americans) had an equal chance of being chosen for the polls.
One way to solve this problem is simple random sampling, where any sample of correct size has equal chance of being the one chosen. It follows that every member of the population is equally likely to be chosen. If a polling company wants to predict an election, they might randomly choose 1,000 names from the electoral roll and askthose people how they expect to vote.
In order to make random selections, it is useful to use a random number table.
This is an array consisting of copies of the digits 0, 1, 2, 3, 4, 5, 6, 7, 8, 9 with no pattern whatsoever. Each digit has probability 1/10 of being the entry in any particular position. Figure 1.1 is an example, although tables used in practice could be much larger, spread over several pages. The entries in each row have been collected in columns of width 5, and the rows and columns of the table have been labeled for ease of reference.
Suppose your University has 8,000 students and you wish to choose a simple random sample of 50 students. First, obtain a list of all students. This will not be random—it will probably be in alphabetical order, or else divided by faculties or years. Then choose 50 numbers in the range from 1 to 8,000. This could be done by selecting ten rows—say rows 1, 3, 4, 7, 11, 12, 16, 20, 21 and 31—and five columns—say 2, 3, 4, 6 and 7. In each case, select the number formed by the first four digits in the entry. For example, row 4, column 3 results in number 1,219.
Row 7, column 4 yields 0176; ignore the initial zero and the number is 176. When you have finished, delete any repeats or numbers over 8,000 and select enough new numbers to give 50 choices. Then use these numbers to select students: 1,219 means you select the 1,219th member of the student list.
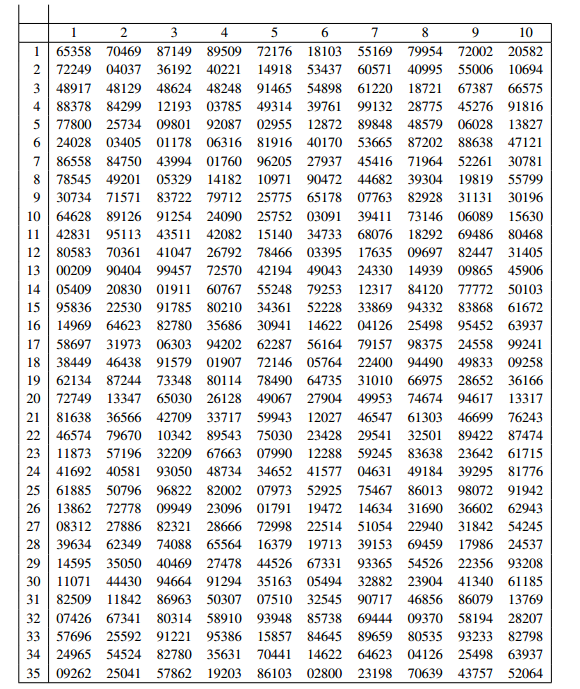
Fig. 1.1 A table of random integers
The process described would be very tedious, but computers can be used to do the steps. There are also random number generating programs available.
Of course, the numbers in the table will not really be random; they were generated by a computer, and if you know the program you could presumably predict the number in any position. But for practical purposes, the numbers behave as random.
Another method is stratified sampling, where the sampling organization tries to select proportionally from the population. In the voting example, suppose a city voted 35% Republican, 25% Democrat in the last election; 40% did not vote. In order to poll 1,000 voters, a polling company might wish to survey 350 chosen from those who voted Republican last time, 250 Democrats and 400 who did not vote.


 قسم الشؤون الفكرية يصدر كتاب (سر الرضا) ضمن سلسلة (نمط الحياة)
 المكياج بلا حدود.. ظاهرة متنامية تُقلق القيم وتُنهك الذات
 جاهزية الاستعداد لشهر رمضان


