![]()


تاريخ الرياضيات

الاعداد و نظريتها
تاريخ التحليل
تار يخ الجبر
الهندسة و التبلوجي
الرياضيات في الحضارات المختلفة
العربية
اليونانية
البابلية
الصينية
المايا
المصرية
الهندية
الرياضيات المتقطعة
المنطق
اسس الرياضيات
فلسفة الرياضيات
مواضيع عامة في المنطق
الجبر
الجبر الخطي
الجبر المجرد
الجبر البولياني
مواضيع عامة في الجبر
الضبابية
نظرية المجموعات
نظرية الزمر
نظرية الحلقات والحقول
نظرية الاعداد
نظرية الفئات
حساب المتجهات
المتتاليات-المتسلسلات
المصفوفات و نظريتها
المثلثات
الهندسة
الهندسة المستوية
الهندسة غير المستوية
مواضيع عامة في الهندسة
التفاضل و التكامل
المعادلات التفاضلية و التكاملية
معادلات تفاضلية
معادلات تكاملية
مواضيع عامة في المعادلات
التحليل
التحليل العددي
التحليل العقدي
التحليل الدالي
مواضيع عامة في التحليل
التحليل الحقيقي
التبلوجيا
نظرية الالعاب
الاحتمالات و الاحصاء
نظرية التحكم
بحوث العمليات
نظرية الكم
الشفرات
الرياضيات التطبيقية
نظريات ومبرهنات
علماء الرياضيات
500AD
500-1499
1000to1499
1500to1599
1600to1649
1650to1699
1700to1749
1750to1779
1780to1799
1800to1819
1820to1829
1830to1839
1840to1849
1850to1859
1860to1864
1865to1869
1870to1874
1875to1879
1880to1884
1885to1889
1890to1894
1895to1899
1900to1904
1905to1909
1910to1914
1915to1919
1920to1924
1925to1929
1930to1939
1940to the present
علماء الرياضيات
الرياضيات في العلوم الاخرى
بحوث و اطاريح جامعية
هل تعلم
طرائق التدريس
الرياضيات العامة
نظرية البيان

Probability Models
 المؤلف:
W.D. Wallis
المؤلف:
W.D. Wallis
 المصدر:
Mathematics in the Real World
المصدر:
Mathematics in the Real World
 الجزء والصفحة:
39-40
الجزء والصفحة:
39-40
 14-2-2016
 2034
2034


A probability model consists of a sample space together with the list of all probabilities of the different outcomes.
One example is a fair die, whose outcomes 1, 2, 3, 4, 5, 6 have probabilities
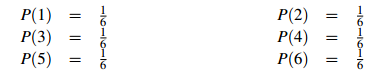
This is a perfectly good probability model.
Another is a biased die, whose outcomes 1, 2, 3, 4, 5, 6 have probabilities
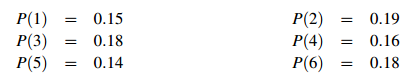
This is still a good probability model, because the probabilities still add to 1.
In some cases there is no numerical value associated with the outcomes— for example, predicting the weather. However, in many probability models, each outcome is a number, or has a numerical value. For example, this is true of rolling dice.
For example, suppose you are playing a game with three outcomes, call them A,B,C. If the outcome is A, you win $10. If it is B, you win $2. And if it is C, you lose $15. The game is completely random, and observations show that A and C each occur 40% of the time, while B is the result of 20% of plays.
If the game were played 100 times, your best guess would be that A came up 40 times, B 20 and C 40. So someone who played 100 times might expect to win $(10 × 40 + 2 × 20), or $440, and lose $15 × 40 = $600. The net loss is $160, or $1.60 per play. You would say this is the expected cost of a play.
In general, suppose an occurrence has a numerical value associated with outcome, and a probability also. The expected value of the occurrence is found by multiplying each value by the associated probability, and adding. This is also called the mean value, or mean of the occurrence. The mean is most commonly denoted m.
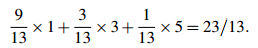
Sample Problem 1.1 You are playing a game where you draw cards from a standard pack. If you draw a 2, 3, . . . , or 10, you score 1 point; a Jack, Queen or King is worth 3; and an Ace is 5 points. How many points would you get for a typical draw?
Solution. The probability of a draw worth 1 point is 36/52, or 9/13, since 36 of the 52 cards are worth 1 point, Similarly, the probabilities of 3 and 5 are 3/13 and 1/13 respectively. So the expected value is
Similar calculations can be applied to any probability model where the outcomes have values associated with them.


 قسم الشؤون الفكرية يصدر كتاب (سر الرضا) ضمن سلسلة (نمط الحياة)
 المكياج بلا حدود.. ظاهرة متنامية تُقلق القيم وتُنهك الذات
 جاهزية الاستعداد لشهر رمضان


