تاريخ الرياضيات

الاعداد و نظريتها
تاريخ التحليل
تار يخ الجبر
الهندسة و التبلوجي
الرياضيات في الحضارات المختلفة
العربية
اليونانية
البابلية
الصينية
المايا
المصرية
الهندية
الرياضيات المتقطعة
المنطق
اسس الرياضيات
فلسفة الرياضيات
مواضيع عامة في المنطق
الجبر
الجبر الخطي
الجبر المجرد
الجبر البولياني
مواضيع عامة في الجبر
الضبابية
نظرية المجموعات
نظرية الزمر
نظرية الحلقات والحقول
نظرية الاعداد
نظرية الفئات
حساب المتجهات
المتتاليات-المتسلسلات
المصفوفات و نظريتها
المثلثات
الهندسة
الهندسة المستوية
الهندسة غير المستوية
مواضيع عامة في الهندسة
التفاضل و التكامل
المعادلات التفاضلية و التكاملية
معادلات تفاضلية
معادلات تكاملية
مواضيع عامة في المعادلات
التحليل
التحليل العددي
التحليل العقدي
التحليل الدالي
مواضيع عامة في التحليل
التحليل الحقيقي
التبلوجيا
نظرية الالعاب
الاحتمالات و الاحصاء
نظرية التحكم
بحوث العمليات
نظرية الكم
الشفرات
الرياضيات التطبيقية
نظريات ومبرهنات
علماء الرياضيات
500AD
500-1499
1000to1499
1500to1599
1600to1649
1650to1699
1700to1749
1750to1779
1780to1799
1800to1819
1820to1829
1830to1839
1840to1849
1850to1859
1860to1864
1865to1869
1870to1874
1875to1879
1880to1884
1885to1889
1890to1894
1895to1899
1900to1904
1905to1909
1910to1914
1915to1919
1920to1924
1925to1929
1930to1939
1940to the present
علماء الرياضيات
الرياضيات في العلوم الاخرى
بحوث و اطاريح جامعية
هل تعلم
طرائق التدريس
الرياضيات العامة
نظرية البيان

Events and Probabilities
 المؤلف:
W.D. Wallis
المؤلف:
W.D. Wallis
 المصدر:
Mathematics in the Real World
المصدر:
Mathematics in the Real World
 الجزء والصفحة:
34-38
الجزء والصفحة:
34-38
 14-2-2016
 3352
3352


+
-
20
Much of the language of probability comes from considering experiments. An experiment is defined to be any activity with well-defined, observable outcomes or results. For example, a coin flip has the outcomes “head” and “tail.” The act of looking out the window to check on the weather has the possible results “it is sunny,” “it is cloudy,” “it is raining,” “it is snowing,” and so on. Both of these activities fit our definition of an “experiment.”
The set of all possible outcomes of an experiment is the sample space. Each subset of the sample space is called an event. For our purposes, an event is simply a set of outcomes. For example, when we talk about the weather we might say there are four possible outcomes: sunny, cloudy, rain, or snow. So we could say the sample space is the set {sunny, cloudy, rain, snow}. The event “today is fine” consists of the outcomes sunny and cloudy. The event “It is not snowing” consists of sunny, cloudy, and rain. The different events can occur at the same time (for example, on a sunny day), so we say the events are not mutually exclusive.
When we roll a die, we are primarily interested in seeing which number is uppermost, so the sample space is the set S = {1,2,3,4,5,6}. The event “an odd number is rolled,” for example, is the subset {1,3,5}. There are 26 events (the number of subsets of the six-element set S)
Remember, probability 0 means the particular event cannot occur— impossibility. And probability 1 means the event must occur—certainty.
The probability of an event equals the sum of the probabilities of its outcomes.
Sample Problem 1.1 Consider a die that is weighted so that 1 is rolled one time in 5 and all other rolls are equally likely. What is the probability of rolling an even number?
Solution. P(1) = 0.2, so the probabilities of the other five rolls must add to 0.8.
They are equal, so P(2) = P(3) = P(4) = P(5) = P(6) = 0.16. So the probability of an even roll is 0.16+0.16+0.16= 0.48.
Sample Problem 1.2 Betty and John roll a die. If the result is a 1 or 2, John wins $2 from Betty; otherwise Betty wins $1 from John. What is the event “John wins”?
Solution. {1,2}.
The elementary counting principles from (Counting) will come in handy when computing probabilities. For example, if event 1 has x possible outcomes, event 2 has y possible outcomes, and the two events are not related, then the compound event “event 1 followed by event 2” has xy possible outcomes. For example, “roll a die, look at score, roll again” has 6 × 6 = 36 outcomes. If an act has n possible outcomes, then carrying it out k times in succession, independently, has nk possible outcomes.
One convenient way to represent this sort of situation is a tree diagram Consider the experiment where a coin is tossed; the possible outcomes are “heads” and “tails” (H and T). The possible outcomes can be shown in a diagram like the one in Fig. 1.1a. A special point (called a vertex) is drawn to represent the start of the experiment, and lines are drawn from it to further vertices representing the outcomes, which are called the first generation. If the experiment has two or more stages, the second stage is drawn onto the outcome vertex of the first stage, and all these form the second generation, and so on. The result is called a tree diagram. Figure 1.1b shows the tree diagram for an experiment where a coin is tossed twice.
Sample Problem 1.3 A coin is flipped three times; each time the result is written down. What is the sample space? Draw a tree diagram for the experiment.
Solution. The sample space is
{HHH,HHT,HTH,HTT,THH,THT,TTH,TTT}.
The tree diagram is shown in Fig. 1.2a.
The situation is more complicated where the outcome of the first event can influence the outcome of the second event, and so on. Again, tree diagrams are useful. We modify the previous example slightly.
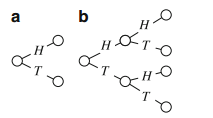
Fig. 1.1 Tree diagrams
Sample Problem 1.4 A coin is flipped up to three times; you stop flipping as soon as a head is obtained. What is the sample space? Draw a tree diagram for the experiment.
Solution. The sample space is {H,TH,TTH,TTT}. The tree diagram is shown in Fig. 1.2b.
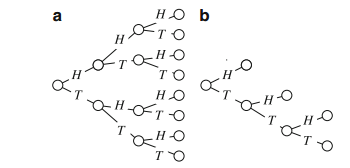
Fig. 1.2 Tree diagrams for Sample Problems 1.3 and 1.4
Sample Problem 1.5 An experiment consists of flipping three identical coins simultaneously and recording the results. What is the sample space?
Solution. {HHH,HHT,HTT,TTT}. Notice that the order is not relevant here, so that for example, the events HHT, HTH and THH of Sample Problem 1.3 are all the same event in this case.
One common application of tree diagrams is the family tree, which records the descendants of an individual. The start is the person, the first generation represents his or her children, the second the children’s children, and so on. (This is why the word “generation” is used when talking about tree diagrams.)
Since events are sets, we can use the language of set theory in describing them.
We define the union and intersection of two events to be the events whose sets are the union and intersection of the sets corresponding to the two events. For example, in Sample Problem 3.2, the event “either John wins or the roll is odd” is the set {1,2}∪{1,3,5} = {1,2,3,5}. (For events, just as for sets, “or” carries the understood meaning, “or both”.) The complement of an event is defined to have associated with it the complement of the original set in the sample space; the usual interpretation of the complement E of the event E is “E doesn’t occur.” Venn diagrams can represent events, just as they can represent sets.
The language of events is different from the language of sets in a few cases. If S
is the sample space, then the events S and 0/ are called “certain” and “impossible.”
If U and V have empty intersection, they are disjoint sets, but we call them mutually
exclusive events (to be consistent with ordinary English usage).
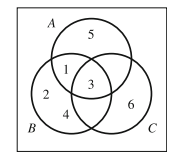
Sample Problem 1.6 A die is thrown. Represent the following events in a Venn diagram:
A: An odd number is thrown;
B: A number less than 5 is thrown;
C: A number divisible by 3 is thrown.
Solution.
Sample Problem 1.7 A coin is tossed three times. Events A, B, and C are defined as follows:
A: The number of heads is even;
B: The number of tails is even;
C: The first toss comes down heads.
Write down the outcomes in A, B, C, A ∪C, B ∩C, and C. Are any of the sets mutually exclusive? Write a brief description, in words, of B∩C.
Solution. A = {HHT,HTH,THH,TTT}, B = {HHH,HTT,THT, TTH},
C = {HHH,HHT,HTH,HTT}, A ∪ C = {HHH,HHT,HTH, HTT,THH,TTT},
B∩C = {HHH,HTT}, and C- = {THH,THT,TTH, TTT}.
A and B are mutually exclusive, as are A and B∩C. B∩C consists of all outcomes with a head first and the other two results equal.
Suppose all the different outcomes are equally likely. Say S is the sample space, and E is the set of all outcomes which we can describe as saying a certain event happens.
For example, rolling a die, say the event is “score 5 or more.” Then
S = {1,2,3,4,5,6}
E = {5,6}
and
P(event happens) = |E|/|S|.
(In the example, this equals 2/6.)
 الاكثر قراءة في الاحتمالات و الاحصاء
 اخر الاخبار
اخبار العتبة العباسية المقدسة

الآخبار الصحية


 قسم الشؤون الفكرية يصدر كتاباً يوثق تاريخ السدانة في العتبة العباسية المقدسة
 "المهمة".. إصدار قصصي يوثّق القصص الفائزة في مسابقة فتوى الدفاع المقدسة للقصة القصيرة
 (نوافذ).. إصدار أدبي يوثق القصص الفائزة في مسابقة الإمام العسكري (عليه السلام)