The Origin of Fragmentation Patterns
When the vaporized organic sample passes into the ionization chamber of a mass spectrometer, it is bombarded by a stream of electrons. These electrons have a high enough energy to knock an electron off an organic molecule to form a positive ion. This ion is called the molecular ion - or sometimes the parent ion and is often given the symbol M+ or  . The dot in this second version represents the fact that somewhere in the ion there will be a single unpaired electron. That's one half of what was originally a pair of electrons - the other half is the electron which was removed in the ionization process.
The molecular ions are energetically unstable, and some of them will break up into smaller pieces. The simplest case is that a molecular ion breaks into two parts - one of which is another positive ion, and the other is an uncharged free radical.


The uncharged free radical will not produce a line on the mass spectrum. Only charged particles will be accelerated, deflected and detected by the mass spectrometer. These uncharged particles will simply get lost in the machine - eventually, they get removed by the vacuum pump.
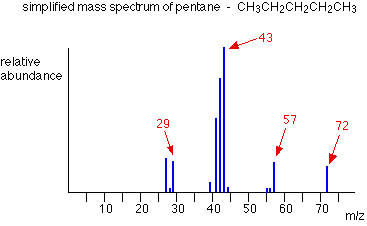
The ion, X+, will travel through the mass spectrometer just like any other positive ion - and will produce a line on the stick diagram. All sorts of fragmentations of the original molecular ion are possible - and that means that you will get a whole host of lines in the mass spectrum. For example, the mass spectrum of pentane looks like this:

Note
The pattern of lines in the mass spectrum of an organic compound tells you something quite different from the pattern of lines in the mass spectrum of an element. With an element, each line represents a different isotope of that element. With a compound, each line represents a different fragment produced when the molecular ion breaks up.
In the stick diagram showing the mass spectrum of pentane, the line produced by the heaviest ion passing through the machine (at m/z = 72) is due to the molecular ion. The tallest line in the stick diagram (in this case at m/z = 43) is called the base peak. This is usually given an arbitrary height of 100, and the height of everything else is measured relative to this. The base peak is the tallest peak because it represents the commonest fragment ion to be formed - either because there are several ways in which it could be produced during fragmentation of the parent ion, or because it is a particularly stable ion.


